Fed’s balance sheet: To infinity and beyond?

Executive Summary
In the first of two reports, we discuss the extraordinary growth in the Fed's balance sheet, which has shot up to nearly $7 trillion at present from $4.2 trillion in early March. Under our base-case scenario, in which the economy continues to gradually recover and tensions do not spike again in financial markets, we see the balance sheet growing to roughly $7.6 trillion by the end of 2020. But in a "worse-case" scenario, it could easily grow to $11 trillion by year-end. We will address the economic and financial market implications of balance sheet growth in a follow-up report.
The Balance Sheet Has Become an Important Tool for the Fed
The Federal Reserve responded to the initial economic and financial fallout from the COVID-19 pandemic with extraordinary speed. Not only did the Federal Open Market Committee (FOMC) slash its target range for the fed funds rate 150 bps in a two-week period in March 2020, but it also implemented a number of asset purchase and lending programs that caused the Fed's balance sheet to mushroom to $7.2 trillion in mid-June from $4.2 trillion at the beginning of March. The size of the balance sheet has edged down a bit in recent weeks, but the FOMC's mantra has been that it "is committed to using its full range of tools to support the U.S. economy in this challenging time." In other words, the FOMC is willing to increase the size of the Fed's balance sheet even further if it will help the U.S. economy recover from its pandemic-induced coma.
So will the balance sheet of the Federal Reserve continue to expand and if so, how big will it get? Furthermore, what are some of the implications of balance sheet growth of the nation's central bank? We tackle the first two questions in this report, and we will address the question regarding implications of balance sheet growth in a follow-up report.
It is important to recall that the left side of the balance sheet (assets) must equal the right side of the balance sheet (liabilities and capital). Moreover, which side of the balance sheet is driving the balance sheet's total size has varied during different periods in the last couple of decades. Before analyzing the future size of the balance sheet, we will briefly discuss its evolution over the past 15 years to provide some context for the current situation.
The Balance Sheet First Exploded During the Financial Crisis
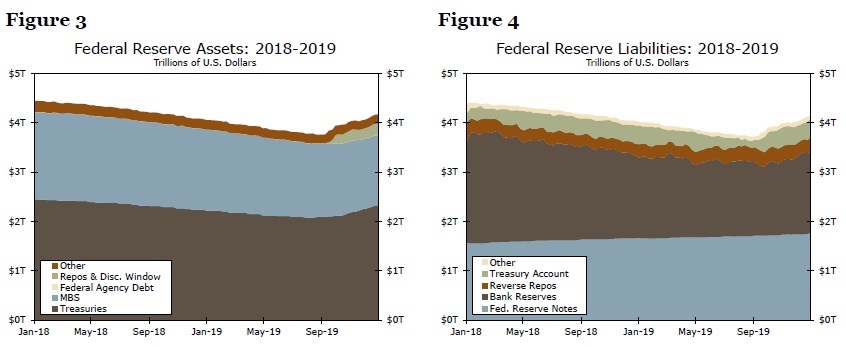
Prior to the global financial crisis (GFC), which began in 2007, the Fed's balance sheet was rather simple. The asset side consisted almost entirely of the central bank's holdings of U.S. Treasury securities (Figure 1), while Federal Reserve notes (i.e., currency in circulation) comprised the vast majority of the liability side (Figure 2). On the eve of the GFC, the balance sheet totaled about $900 billion. During the pre-GFC period, the liability side of the balance sheet was the key driver of the balance sheet's total size. As public demand for currency increased, the Federal Reserve created a new liability (currency) that was offset on the asset side by a Treasury security. It was primarily the public's demand for cash, rather than any particularly desired level of Treasury holdings, that drove the size of the Fed's balance sheet.
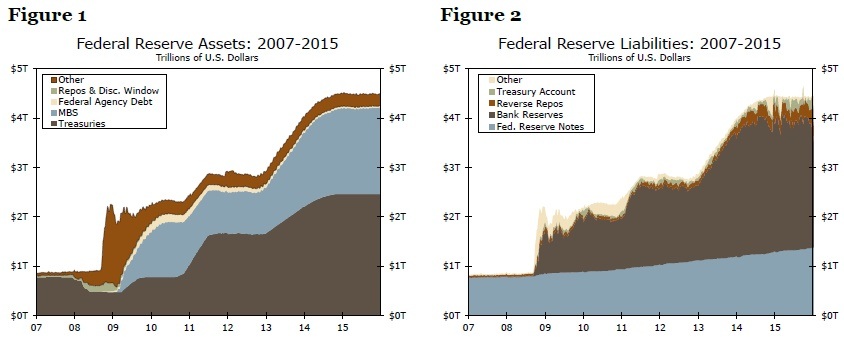
But once the GFC began, the Fed had to initiate a series of emergency lending programs to pump liquidity into the financial system. And from a monetary policy perspective, cutting interest rates all the way to 0% was still not enough accommodation given the depth of the downturn. So the Federal Reserve started to use its balance sheet to provide further monetary support. In that regard, the Fed implemented its quantitative easing (QE) program, which involved the purchase of Treasury securities and mortgage-backed securities (MBS). By the conclusion of the QE program in late 2014, the central bank's balance sheet had swollen to about $4.5 trillion.
Source: Federal Reserve Board and Wells Fargo Securities
The Fed financed its QE purchases of Treasury securities and MBS via the creation of bank reserves. That is, the central bank bought Treasuries and MBS from financial institutions and credited the reserve accounts that these institutions hold at the Federal Reserve. The primary objective of the QE program was to bring down yields on U.S. Treasury securities and MBS in an effort to jumpstart the U.S. economy, which had been laid low by the financial crisis. Therefore, the Fed was focused on expanding the asset side of its balance sheet during those years; the liability side of the balance sheet more or less increased in a mechanical fashion.
Fed Shifts Focus to Liabilities in September 2019
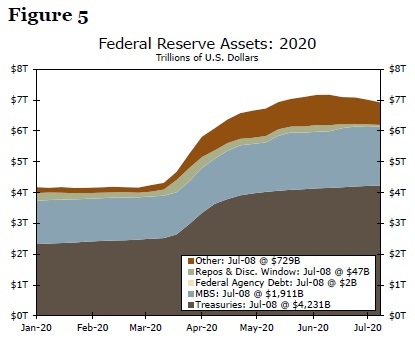
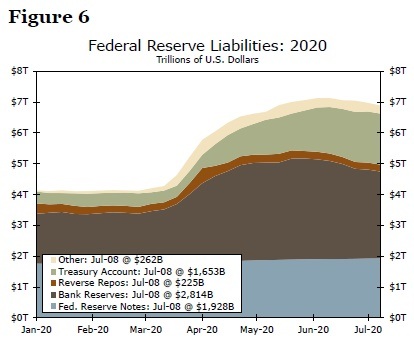
But the Fed's focus shifted to the liability side of its balance sheet again in September 2019. Starting in October 2017, the Federal Reserve allowed maturing securities to roll off the balance sheet without replacing them with new purchases. Consequently, the size of the balance sheet shrank from about $4.4 trillion in late 2017 to less than $3.8 trillion in September 2019 (Figure 3). Importantly, banking system reserves, which comprise a large portion of the cash balances of the nation's commercial banks, receded from approximately $2.2 trillion to roughly $1.4 trillion over that period (Figure 4). As we wrote in a September 2019 report, this decline in bank reserves contributed to a spike in short-term interest rates at that time.
This spike in short-term interest rates in September 2019 led Fed policymakers to conclude that they needed to boost banking system reserves because they had fallen to insufficient levels. So the Fed engaged in a number of repurchase agreements (repos) and outright purchases of Treasury bills that had the effect of lifting reserves from $1.4 trillion in September to nearly $1.7 trillion in December. The important point is that the Federal Reserve was now focused on the liability side of its balance sheet. That is, the Fed's objective during this period was to increase the amount of banking system reserves to reduce the volatility in short-term interest rates. Holdings of Treasury securities, which are an asset of the central bank, mechanically rose as part of the repo operations/outright purchases.1
Source: Federal Reserve Board and Wells Fargo Securities
Balance Sheet Has Mushroomed by Nearly $3 Trillion since March
As noted previously, the Fed's balance sheet mushroomed this year to $7.2 trillion in mid-June from $4.2 trillion at the beginning of March, as the FOMC implemented programs to support the economy. In the context of the preceding narrative, the Fed's focus has shifted back to the asset side of its balance sheet. Most of the growth in the balance sheet since March reflects the re-institution of QE, which has caused Fed holdings of Treasury securities and MBS to jump $1.7 trillion and $540 billion, respectively (Figure 5).
But other items on the asset side of the central bank's balance sheet, which the FOMC has utilized to lend directly and indirectly to financial institutions, have grown as well. When the economy began to shut down in March, the Federal Reserve re-deployed some programs that it created during the financial crisis. Specifically, the Fed brought back to life the Commercial Paper Funding Facility (CPFF), which purchases commercial paper, and the Term Asset Liquidity Facility (TALF), which provides loans to issuers of bonds that are securitized by household debt such as auto loans, student loans and credit cards. The combined size of these two programs currently totals about $22 billion, $17 billion of which is an equity stake from the Treasury.
Other crisis era programs that were revived include the Primary Dealer Credit Facility (PDCF) and the Money Market Mutual Fund Liquidity Facility (MMLF). The Fed also created the Paycheck Protection Program Liquidity Facility (PPPLF) to supply liquidity via term funding to banks participating in the Paycheck Protection Program. The utilization of these programs has generally declined as tensions in financial markets have eased in recent months. Specifically, the combined assets of the PDCF, the MMLF and the PPPLF have levelled off at around $92 billion. In addition, the amount of foreign currency swaps, which the Fed has extended to foreign central banks so they can provide dollar liquidity to their own commercial banks, has dropped from nearly $450 billion in late May to $182 billion at present. The $440 billion worth of repos that the Fed conducted with domestic financial institutions at the height of the financial market volatility in March have now completely rolled off the Fed's books.
There are some other programs which are relatively small presently, but which could potentially see increased use in coming weeks and months. The combined size of the Primary and the Secondary Corporate Credit Facilities, which purchase corporate bonds, is currently $42 billion, and about $32 billion of this amount reflects the initial equity injection into the facilities by the Treasury Department. Corporate bond purchases have averaged roughly $2 billion per week recently, and these two facilities have the potential to grow up to a combined amount of $750 billion. The current size of the Municipal Liquidity Facility (MLF), through which the Federal Reserve can offer financial support to state and local governments, is only $16 billion, and about $14 billion of that amount is Treasury equity. But, this facility could potentially grow up to $500 billion. Finally, there is the Main Street Lending Program (MSLP), through which the Fed buys certain loans that commercial banks have made to their commercial customers. This facility has become operational in only the past week or so, and anecdotal evidence suggests that utilization has been very low thus far. The maximum size of the MSLP is $600 billion.
Source: Federal Reserve Board and Wells Fargo Securities
The sharp rise on the asset side of the Fed's balance sheet has obviously been met by a corresponding increase on the liability side (Figure 6). Bank reserves and the U.S. Treasury's General Account, more informally known as the Treasury's cash balance, have risen by $1.3 trillion each since early March.2 Interestingly, currency in circulation, which has grown at a fairly steady pace of 5% to 7% per annum in recent years, is up more than $160 billion (a 9% increase) since early March. But as noted above, this increase on the liability side of the central bank's balance sheet has to a large extent mechanically followed the rise on the asset side, which the Federal Reserve is growing in an effort to cushion the economic and financial fallout from the pandemic.
Where Do We Go From Here?
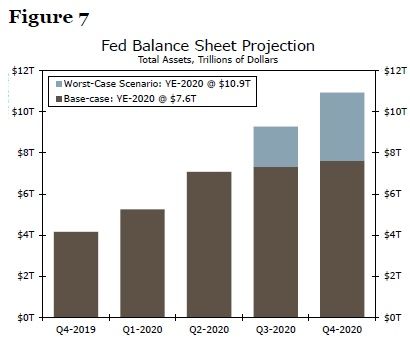
In our view, the Federal Reserve likely will continue to use the asset side of its balance sheet as needed to support the continued recovery of the U.S. economy, and the liability side will largely adjust in a mechanical fashion. But how large will the balance sheet actually get? The answer to that question depends largely on the evolution of the economy. If, as we forecast, the economy continues to gradually recover, then further growth in the Fed's balance sheet likely will remain modest.3 But if the economy were to enter another downturn in the foreseeable future, then the FOMC likely would increase the size of the balance sheet sharply in an effort to support economic activity as much as possible. Therefore, we make a base-case forecast of the size of the balance sheet, and a forecast under a "worst-case" scenario through the end of the year.
Let's start with the QE purchases of Treasury securities and MBS. Presently, the Fed is buying roughly $20 billion worth of Treasuries and approximately a net $10 billion of MBS each week, and the FOMC recently stated that it would continue to purchase securities "at least at the current pace" in "coming months." We take the FOMC at its word, and under our base-case scenario, we look for the current pace of Treasury and MBS purchases to hold through the end of 2020, with a tapering of purchases beginning at the start of 2021. If realized, continued purchases of securities by the Federal Reserve would increase the size of its balance sheet $720 billion between now and the end of this year.
This increase in holdings of Treasuries and MBS should be partially offset by further declines in the outstanding amount of foreign currency swaps, which, as noted previously, have receded in recent weeks. If, as we project, financial market tensions do not resurface, at least not to the same extent as they did in March and early April, then the amount of foreign currency swaps that the Fed has on its balance sheet should completely roll off as the remaining instruments mature. In short, $182 billion worth of foreign currency swaps should no longer be on the asset side of the Fed's balance sheet by the end of the year.
We assume that the $100 billion or so that is held in aggregate in the PDCF, the PPPLF, the MMLF, the CPFF and the TALF remains constant. The biggest wild card in our balance sheet projection is the evolution of the new lending facilities that are just now getting up and running. For purposes of our base-case scenario, we assume that the corporate bond facilities grow from their current size of $43 billion to $100 billion by the end of this year. We also assume that the assets held in the MLF rise from $16 billion to $50 billion, and that the MSLP has $100 billion worth of assets by year's end. Putting it all together, we project the Fed's balance sheet will grow from its current size of $6.9 trillion to roughly $7.6 trillion by the end of 2020 (Figure 7—brown bars).
Source: Federal Reserve Board and Wells Fargo Securities
If the Treasury's cash balance declines to $1 trillion by year's end, and currency in circulation grows at 4% per quarter in the second half of the year, this would put total bank reserves in our base-case scenario at roughly $3.9 trillion (Figure 8). 4 If realized, this would be an increase of roughly $1 trillion from current levels and more than $2 trillion from where they started the year. This much liquidity in the financial system reinforces our view that borrowing from the Fed's facilities, such as through repurchase agreements, will not be needed in large amounts to keep financial markets operating smoothly.
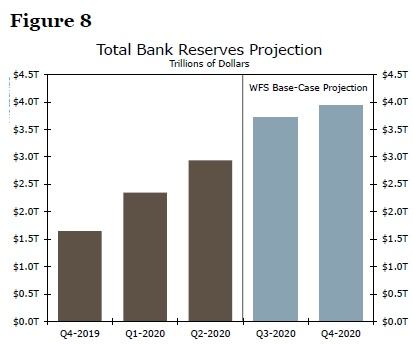
But in a "worst-case" scenario in which the economy rolls over in coming months and financial market tensions spike, then the FOMC likely would want to increase the size of its balance sheet significantly, as it did earlier this year. In this scenario, we assume that the Fed doubles its purchases of Treasuries and MBS, to $160 billion and $80 billion per month, respectively. We also assume that the amount of foreign currency swaps outstanding jumps back up to its May peak of $450 billion, and that the Fed conducts an equivalent amount of repos with domestic financial institutions. Finally, we assume that new corporate bond buying, municipal lending and Main Street Programs are used to their full capacity. Under this "worst-case" scenario, the Fed's balance sheet would balloon to approximately $11 trillion by the end of the year. In this scenario, bank reserves would mushroom to $7.2 trillion, which is nearly 85% higher than in our baseline scenario.
Conclusion
As it did in the aftermath of the GFC, the FOMC is again employing the Fed's balance sheet to provide monetary accommodation to an economy that needs more support than ultra-low interest rates alone can provide. The Fed's QE purchases of securities and the lending programs that it has implemented have caused the balance sheet to increase by nearly $3 trillion since early March. Under our base-case scenario, in which the economy continues to gradually recover and tensions do not spike again in financial markets, we see the balance sheet growing to roughly $7.6 trillion by the end of 2020. But, it could easily grow to $11 trillion by year end under a "worst-case" scenario. Under this scenario, the balance sheet would be equivalent to roughly 50% of U.S. nominal GDP, double the ratio that was reached in 2014 when the balance sheet was previously at a record high.
But what are the implications of growth in the central bank's balance sheet, especially if it approaches the "worst-case" scenario of $11 trillion that we highlighted previously? What are the implications if the Fed's balance sheet grows "to infinity and beyond!"? We will address the potential implications of balance sheet growth in a soon-to-be-published follow-up report.
Author

Wells Fargo Research Team
Wells Fargo


