Fed unlikely to cut target rate, attention on language and SEP

The US Federal Reserve (Fed) will conclude its two-day meeting today at 6:00 pm GMT (with a press conference at 6:30 pm GMT). For many of us, this is one of the week’s dominant asset drivers to monitor and comes at a time when US President Donald Trump’s on-and-off trade policies and growth concerns are front and centre.
Money markets are fully pricing in a no-change decision; the Fed is expected to maintain the federal funds target rate at 4.25% - 4.50%, marking the second consecutive meeting on hold, with the next 25 basis point (bp) cut eyed for July. For the year, 59 bps worth of cuts are also priced in (according to LSEG data), nearly aligning with the Fed’s projections in December 2024.
Rate statement, presser and SEP eyed
With inflation circling north of the Fed’s 2.0% inflation target and economic activity still reasonably robust at this point, as well as the economy adding jobs with a relatively low unemployment rate (at least by historical standards), I do not see any incentive for the Fed to make any adjustment to the target rate this week. Therefore, market participants will focus on the rate statement, Fed Chairman Jerome Powell’s press conference, and the updated economic projections through the Summary of Economic Projections (SEP).
Any language change in the rate statement compared to the previous meeting and Powell’s communication in his presser might be interesting amid prevailing uncertainty. As aired above, the US growth story remains at the forefront of market focus, and for good reason. Markets entered 2025 optimistically: an economy that grew above trend in recent years, bolstered by government spending and Artificial Intelligence (AI), among other things. Crucially, markets expected Trump’s policies to underpin the growth narrative, but this has not happened so far; on the contrary, recession concerns are growing. The fact is that US growth worries are still centre stage amid Trump’s protectionist trade policies, and I do not see that changing right now. So, I think the Fed will reiterate caution and patience at today’s policy meeting, with Powell repeating that the central bank is not in a hurry to cut rates. We will also likely see Quantitative Tightening paused.
Market players will also scrutinise the Fed’s updated economic projections within the SEP, where Fed members underscore their forecasts for inflation, growth, unemployment, and the federal funds target rate. I do not think the Fed will increase its rate cut projections and will likely continue to forecast two rate cuts this year. Consensus suggests that the forecasts will remain at 3.9% for 2025, 3.4% for 2026, and 3.1% for 2027 (see below). However, there is always an outside chance that the rate forecast could be lowered to just one rate cut this year. While I do not believe this will occur, expect a hawkish reaction: bid in US Treasury yields and the US dollar (USD) if it does.
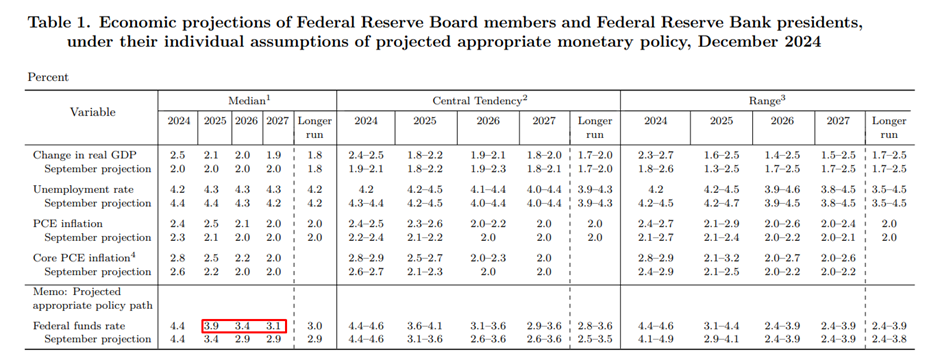
Comparing current data with the December projections, you will find that the data and forecasts are largely aligned. Real US GDP (Gross Domestic Product) increased at an annualised rate of 2.3% (second estimate) for Q4 24; US unemployment for February remained at 4.1%, and PCE inflation (Personal Consumption Expenditures) rose by 2.5% in January year-on-year.
However, analysts anticipate that the central bank could revise GDP lower and inflation higher in the March projections. Consequently, were GDP forecasts to remain unchanged (2.1% in 2025, 2.0% in 2026, and 1.9% in 2027), this would add weight to a hawkish reaction; for inflation, given the consensus favours an upward revision, I am looking for anything north of 2.9% for PCE inflation in 2025 to help prompt a hawkish response.
Downside in USD and the S&P 500?
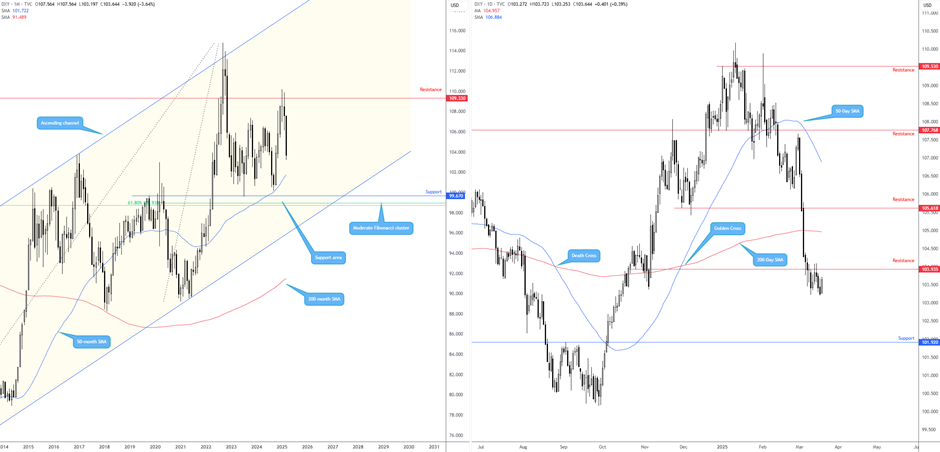
The USD has been volatile, with many traders and pundits expecting a resumption of USD strength this year, but that has not transpired. Consequently, I will continue to monitor the USD Index, which concluded last week marginally on the back foot. Interestingly, the USD is down 4.5% year to date, and March is on track to record losses not seen since November 2024.
As illustrated on the monthly and daily charts below, sellers are strengthening their grip. Monthly flow demonstrates scope to test the 50-month simple moving average (SMA), currently trading at 101.72. I feel this will be a particularly strong technical floor, which happens to be backed by the support of around 99.67. Adding to this bearish scenario, price action on the daily chart recently ventured south of support from 103.94 and retested said boundary as resistance at the tail end of last week. I have found these levels – Quasimodo barriers – particularly effective on retest plays, which is what we have here. And given the absence of any obvious support until 101.92, USD bears will likely remain in the driving seat for the time being and any pullbacks will likely be faded.
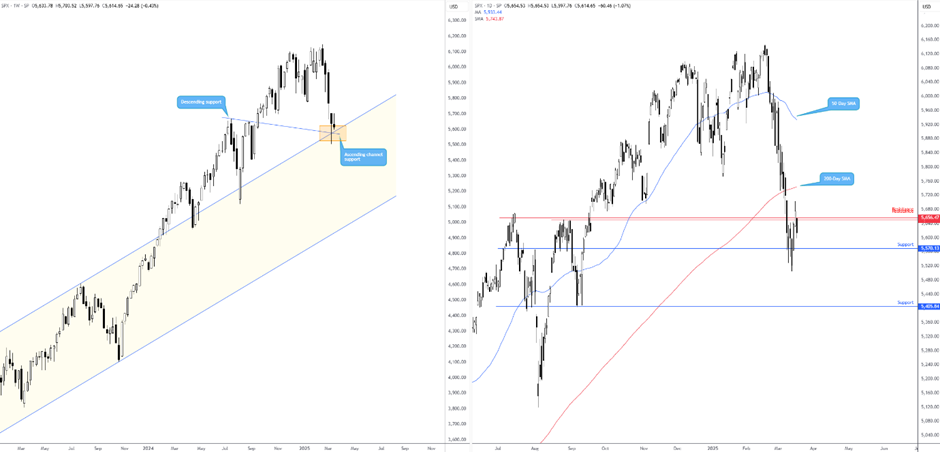
The S&P 500 is another market I am monitoring closely, having seen a broad sell-off occur and consequently pencil in a correction (marked by a 10% drop from highs). Kicking off with the weekly chart (see below on the left), I recently highlighted potential support around the 5,600 neighbourhood. This support zone includes local descending support, extended from the high 5,669, and a channel resistance-turned-support line, taken from the high of 4,119. As you can see, although buyers have made somewhat of an appearance, sellers still seem to have the upper hand.
Meanwhile, on the daily chart (below on the right), support entered at 5,570 last week. Although slow to respond from the area, bulls entered the fight on Friday and added 2.1%. Be that as it may, hefty resistance entered the fray this week around 5,656 and enticed selling (horizontal levels closely shadowed by the 200-day SMA, currently trading at 5,743). Unless this resistance/200-day SMA zone is absorbed, the path of least resistance for US equities on the daily scale appears to be to the downside towards support from 5,405.
Charts created using TradingView
Author

Aaron Hill
FP Markets
After completing his Bachelor’s degree in English and Creative Writing in the UK, and subsequently spending a handful of years teaching English as a foreign language teacher around Asia, Aaron was introduced to financial trading,


