Fed looks at PPI numbers to determine an interest rate cut
USD: Dec '24 is Down at 102.735.
Energies: Nov '24 Crude is Down at 75.13.
Financials: The Dec '24 30 Year T-Bond is Down 3 ticks and trading at 120.03.
Indices: The Dec '24 S&P 500 emini ES contract is 20 ticks Lower and trading at 5824.00.
Gold: The Dec'24 Gold contract is trading Up at 2657.90.
Initial conclusion
This is not a correlated market. The USD is Down and Crude is Down which is not normal, and the 30 Year T-Bond is trading Lower. The Financials should always correlate with the US dollar such that if the dollar is Higher, then the bonds should follow and vice-versa. The S&P is Lower and Crude is trading Lower which is not correlated. Gold is trading Higher which is not correlated with the US dollar trading Up. I tend to believe that Gold has an inverse relationship with the US Dollar as when the US Dollar is down, Gold tends to rise in value and vice-versa. Think of it as a seesaw, when one is up the other should be down. I point this out to you to make you aware that when we don't have a correlated market, it means something is wrong. As traders you need to be aware of this and proceed with your eyes wide open. Asia is trading mainly Lower with exception of the Nikkei and Hang Seng exchanges. All of Europe is trading Higher except the London exchange.
Possible challenges to traders
-
PPI is out at 8:30 AM EST. This is Major.
-
Core PPI is out at 8:30 AM EST. This is Major.
-
FOMC Member Goolsbee Speaks at 9:45 AM EST. This is Major.
-
Prelim UoM Consumer Sentiment is out at 10 AM EST. This is Major.
-
Prelim UoM Inflation Expectations is out at 10 AM EST. This is Major.
-
FOMC Member Logan Speaks at 10:45 AM EST. This is Major.
-
FOMC Member Bowman Speaks at 1:10 PM EST. This is Major.
Traders, please note that we've changed the Bond instrument from the 10 year (ZN) to the 2 year (ZT). They work exactly the same.
We've elected to switch gears a bit and show correlation between the 2-year Treasury notes (ZT) and the S&P futures contract. The YM contract is the Dow Jones Industrial Average, and the purpose is to show reverse correlation between the two instruments. Remember it's likened to a seesaw, when up goes up the other should go down and vice versa.
Yesterday the ZT migrated Higher at around 8:30 AM EST as the CPI numbers were being released and began its Upward Climb. Look at the charts below and you'll see a pattern for both assets. The Dow moved Lower at 8:30 AM and the ZT moved Higher at around the same time. These charts represent the newest version of Bar Charts, and I've changed the timeframe to a 15-minute chart to display better. This represented a Long opportunity on the 2-year note, as a trader you could have netted about 50 plus ticks per contract on this trade. Each tick is worth $7.625. Please note: the front month for ZT is Dec and the Dow is now Dec '24. I've changed the format to filled Candlesticks (not hollow) such that it may be more apparent and visible.
Charts courtesy of barcharts
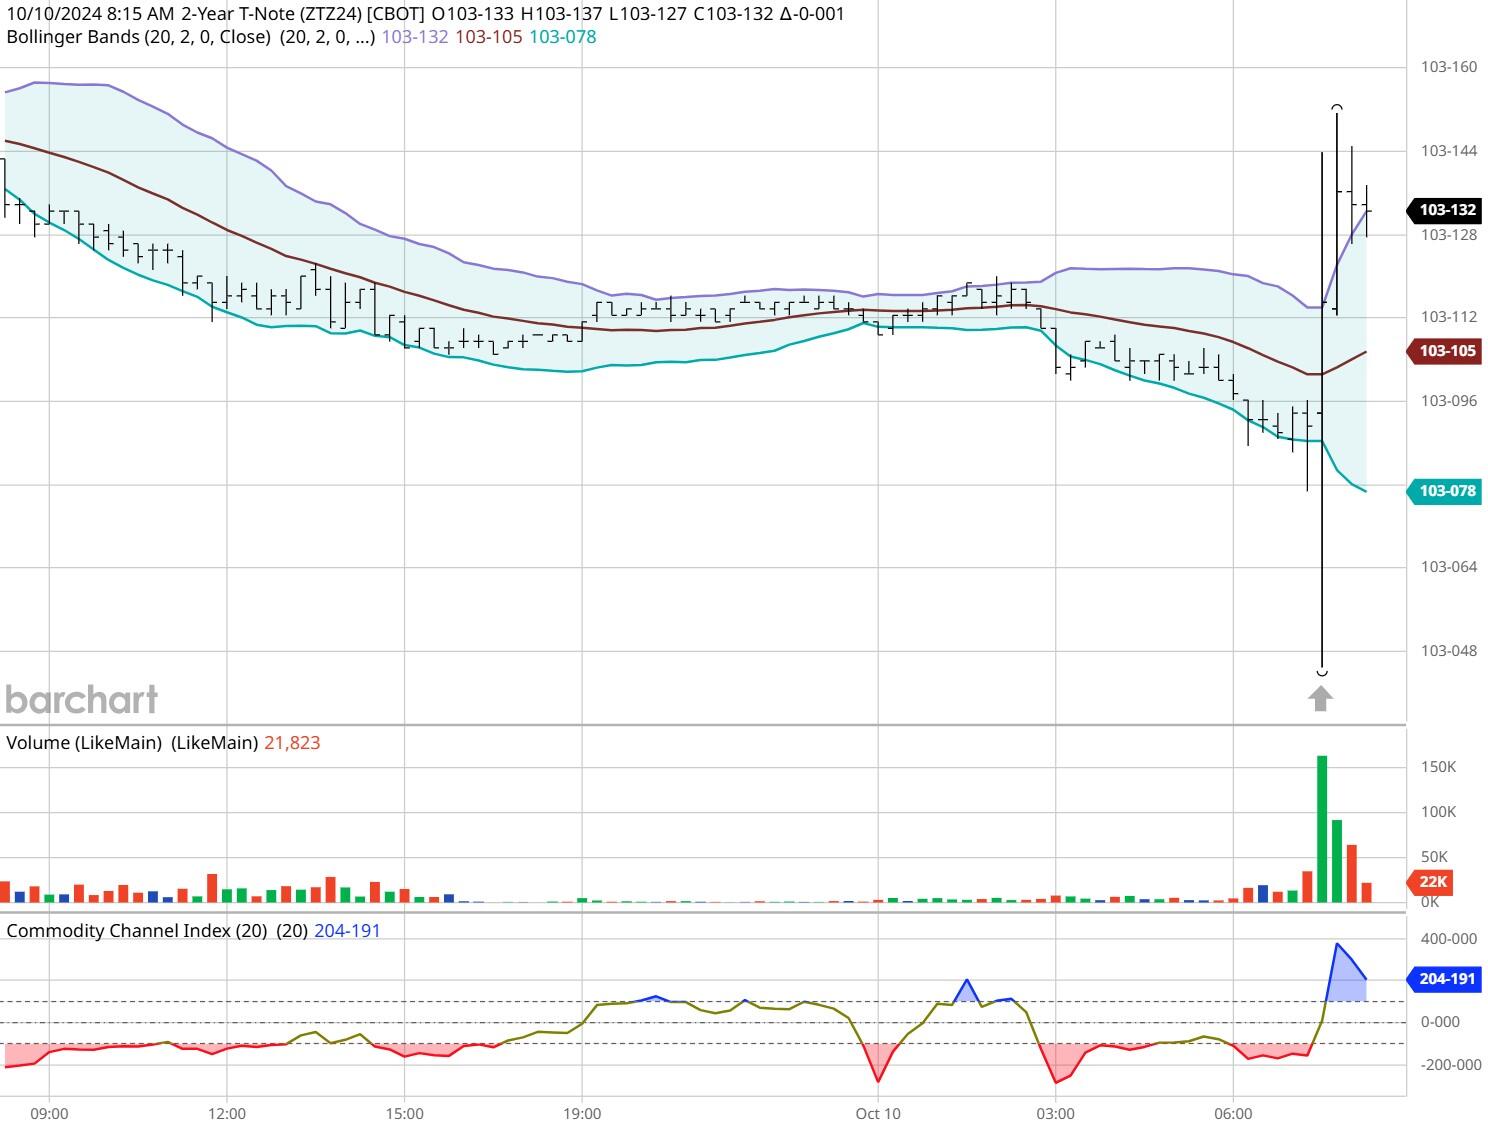
ZT -Dec 2024 - 10/10/24
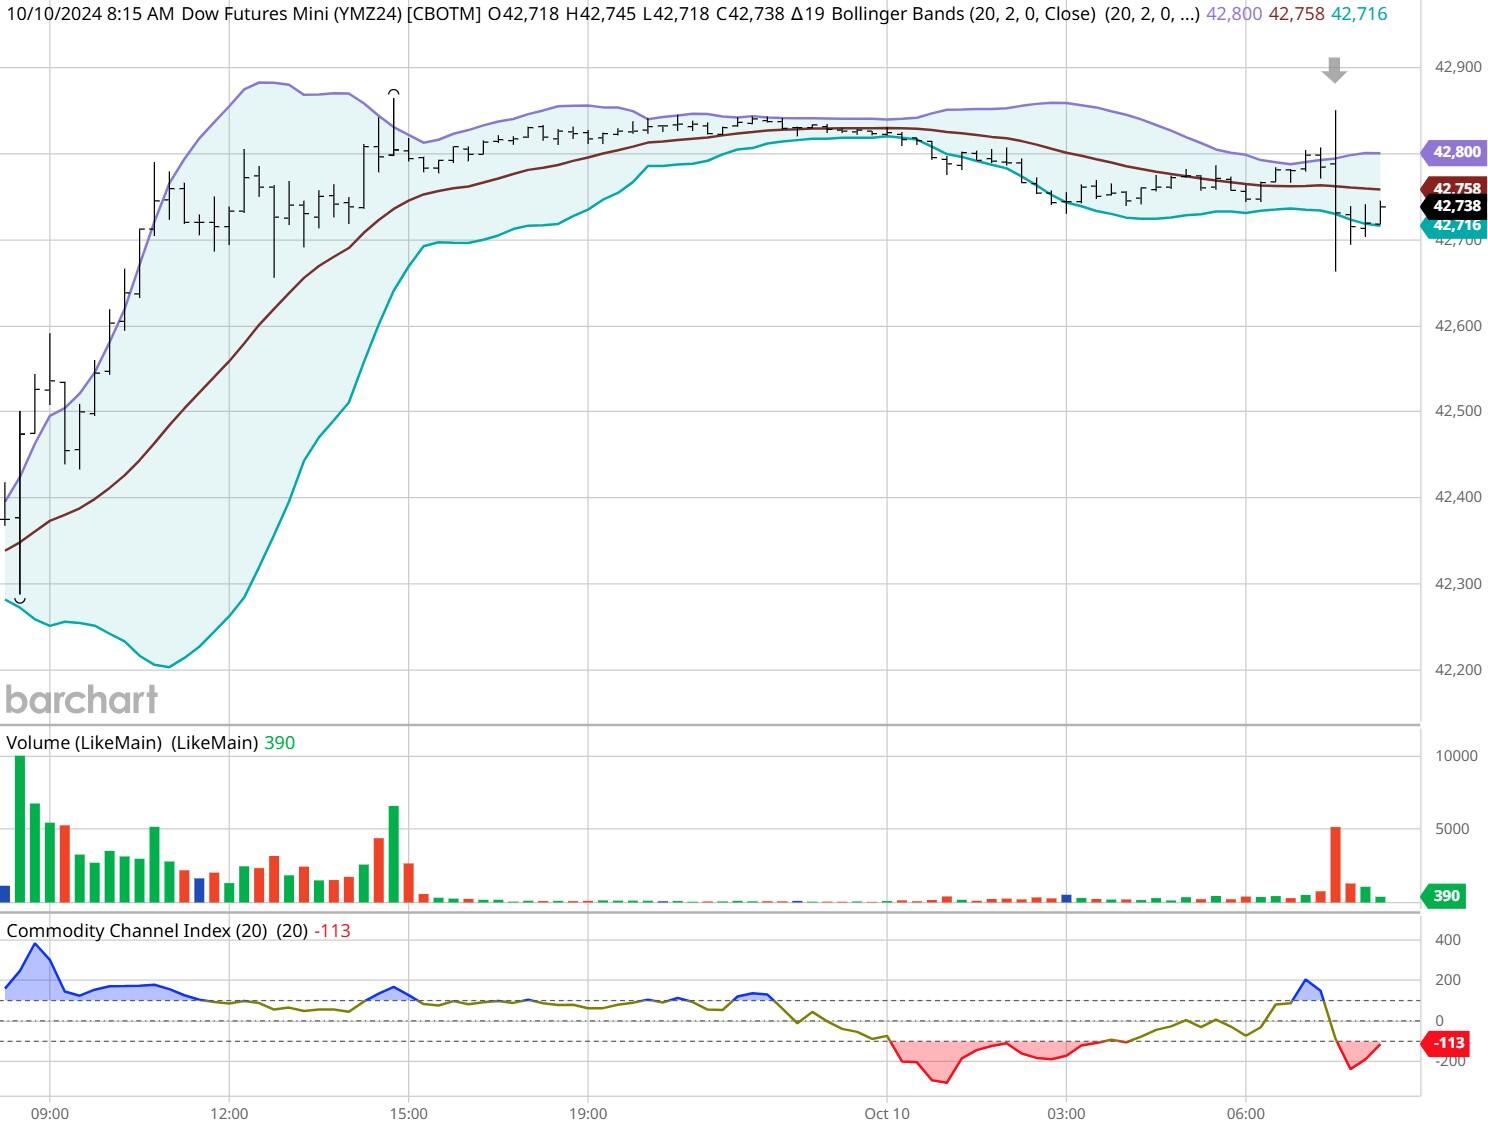
Dow - Dec 2024- 10/10/24
Bias
Yesterday we gave the markets a Downside bias as the USD, Crude and Gold were all trading Higher Thursday morning and that usually reflects a Down Day. The markets didn't disappoint as the Dow traded 58 points Lower and the other indices closed Lower as well. Today we aren't dealing with a correlated market and our bias is Neutral or Mixed.
Could this change? Of Course. Remember anything can happen in a volatile market.
Commentary
Finally, we have a market that works as it should. Yesterday we gave the markets a Downside bias as the USD, Gold and Crude traded Higher Thursday morning and this is reflective of a Down Day. The markets didn't disappoint as the indices all closed Lower Thursday. Today we have the all-important PPI numbers. Think of it as CPI for suppliers and producers of raw materials or components. It's important as it will affect CPI and the Fed looks at those numbers to determine an interest rate cut.
Author

Nick Mastrandrea
Market Tea Leaves


