Fed euphoria over?
USD: Sept '24 is Down at 100.720.
Energies: Sept '24 Crude is Down at 76.90.
Financials: The Sept '24 30 Year T-Bond is Down 16 ticks and trading at 124.01.
Indices: The Sept '24 S&P 500 emini ES contract is 16 ticks Lower and trading at 5633.00.
Gold: The Dec'24 Gold contract is trading Down at 2545.20.
Initial conclusion
This is not a correlated market. The USD is Down and Crude is Down which is not normal, and the 30 Year T-Bond is trading Down. The Financials should always correlate with the US dollar such that if the dollar is Higher, then the bonds should follow and vice-versa. The S&P is Lower and Crude is trading Lower which is not correlated. Gold is trading Lower which is not correlated with the US dollar trading Down. I tend to believe that Gold has an inverse relationship with the US Dollar as when the US Dollar is down, Gold tends to rise in value and vice-versa. Think of it as a seesaw, when one is up the other should be down. I point this out to you to make you aware that when we don't have a correlated market, it means something is wrong. As traders you need to be aware of this and proceed with your eyes wide open. Asia trading mainly Mixed with half the exchanges Higher and the other half Lower. All of Europe is trading Higher.
Possible challenges to traders
S&P/CS Composite-20 HPI y/y is out at 9 AM EST. This is Major.
HPI m/m is out at 9 AM EST. This is Major.
CB Consumer Confidence is out at 10 AM EST. This is Major.
Richmond Manufacturing Index is out at 10 AM EST. This is Major.
Traders, please note that we've changed the Bond instrument from the 10 year (ZN) to the 2 year (ZT). They work exactly the same.
We've elected to switch gears a bit and show correlation between the 2-year Treasury notes (ZT) and the S&P futures contract. The YM contract is the Dow Jones Industrial Average, and the purpose is to show reverse correlation between the two instruments. Remember it's likened to a seesaw, when up goes up the other should go down and vice versa.
Yesterday the ZT migrated Higher at around 9 AM EST. If you look at the charts below the ZT gave a signal at around 9 AM with no real news and started its Upward climb. Look at the charts below and you'll see a pattern for both assets. The Dow moved Lower at 9 AM and the ZT moved Higher at around the same time. These charts represent the newest version of BarCharts, and I've changed the timeframe to a 15-minute chart to display better. This represented a Long opportunity on the 2-year note, as a trader you could have netted about 20 plus ticks per contract on this trade. Each tick is worth $7.625. Please note: the front month for ZT is Sept and the Dow is now Sept '24. I've changed the format to filled Candlesticks (not hollow) such that it may be more apparent and visible.
Charts courtesy of barcharts
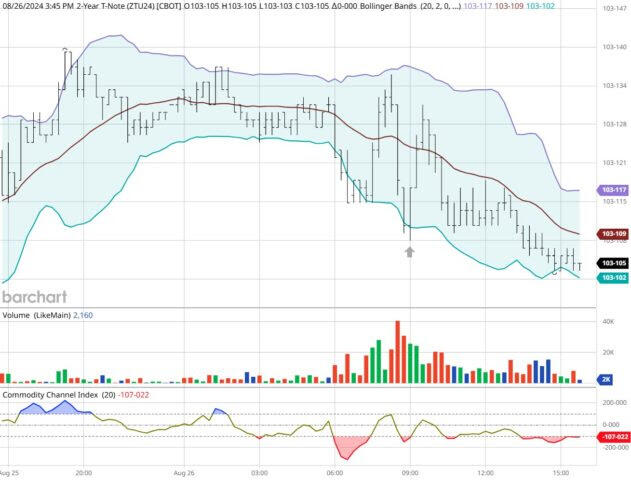
ZT -Sept 2024 - 08/26/24
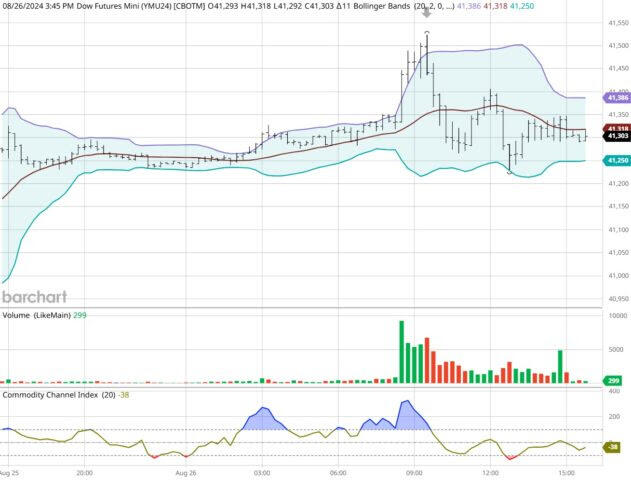
Dow - Sept 2024- 08/26/24
Bias
Yesterday we had no edition so there was no bias but it appears that the markets experienced a Neutral or Mixed Day. The Dow gained 65 points on the day but the other indices lost ground. Today we aren't dealing with a correlated market as all instruments are trading Lower at the present time. As such our bias is Mixed or Neutral.
Could this change? Of Course. Remember anything can happen in a volatile market.
Commentary
So, it looks like the Federal Reserve as finally come to the conclusion that perhaps they should start to Lower the Federal Funds Rate or the FFR. Sometimes this is called the Overnight Rate as this is the rate the Federal Reserve charges banks to borrow money; the banks in turn mark that up and that rate is what we the consumer spends on interest rates. We've been saying this for months and I'm glad they came to that conclusion as late as it is. Not only do they agree that rates should be reduced but it is speculated that they Lower as much as 50 basis points or one half of one percent. No wonder the markets took off on Friday. Today we have Home Price Index and Richmond Manufacturing, both of which are major and proven market movers. In answer to the question Is the Fed Euphoria Over? All we can say is only time will tell.
Author

Nick Mastrandrea
Market Tea Leaves


