Fear still rules

USD: Jun '25 is Down at 102.030.
Energies: May '25 Crude is Down at 55.60.
Financials: The Jun '25 30 Year T-Bond is Lower by 84 ticks and trading at 113.03.
Indices: The Jun '25 S&P 500 emini ES contract is 360 ticks Lower and trading at 4925.00
Gold: The Jun'25 Gold contract is trading Up at 3079.60
Initial conclusion
This is not a correlated market. The USD is Down and Crude is Down which is not normal, and the 30 Year T-Bond is trading Lower. The Financials should always correlate with the US dollar such that if the dollar is Higher, then the bonds should follow and vice-versa. The S&P is Lower and Crude is trading Lower which is not correlated. Gold is trading Higher which is correlated with the US dollar trading Down. I tend to believe that Gold has an inverse relationship with the US Dollar as when the US Dollar is down, Gold tends to rise in value and vice-versa. Think of it as a seesaw, when one is up the other should be down. I point this out to you to make you aware that when we don't have a correlated market, it means something is wrong. As traders you need to be aware of this and proceed with your eyes wide open. Asia traded Mixed. All of Europe is trading Lower.
Possible challenges to traders
-
Final Wholesale Inventory m/m is out at 10 AM EST. This is Major.
-
Crude Oil Inventories is out at 10:30 AM EST. This is Major.
-
FOMC Member Barkin Speaks at 11 AM EST. This is Major.
-
10 Year Bond Auction Starts at 1 PM EST. This is Major.
-
FOMC Meeting Minutes is out at 2 PM EST. This is Major.
Traders, please note that we've changed the Bond instrument from the 10 Year (ZN) to the 2 Year (ZT). They work exactly the same.
We've elected to switch gears a bit and show correlation between the 2-year Treasury notes (ZT) and the S&P futures contract. The YM contract is the Dow Jones Industrial Average, and the purpose is to show reverse correlation between the two instruments. Remember it's likened to a seesaw, when up goes up the other should go down and vice versa.
Yesterday the ZT dived Lower at around 6:35 AM EST with no economic news is sight. The Dow moved Higher at the same time. Look at the charts below and you'll see a pattern for both assets. The Dow moved Higher at 6:35 AM EST and the ZT moved Lower at around the same time. These charts represent the newest version of Bar Charts, and I've changed the timeframe to a 15-minute chart to display better. This represented a Short opportunity on the 2-year note, as a trader you could have netted about 30 plus ticks per contract on this trade. Each tick is worth $6.25. Please note: the front month for ZT is now Jun '25 and the Dow is Jun '25 as well. I've changed the format to filled Candlesticks (not hollow) such that it may be more apparent and visible.
Charts courtesy of BarCharts
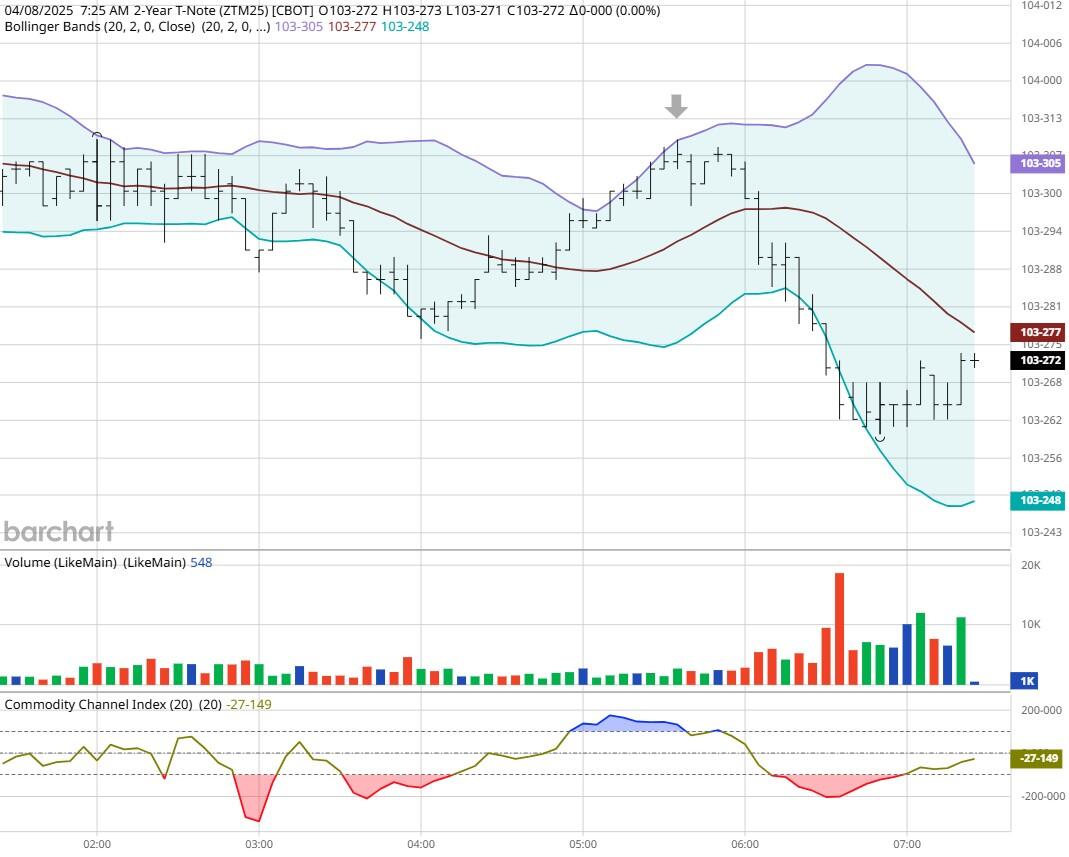
ZT -Jun 2025 - 4/08/25
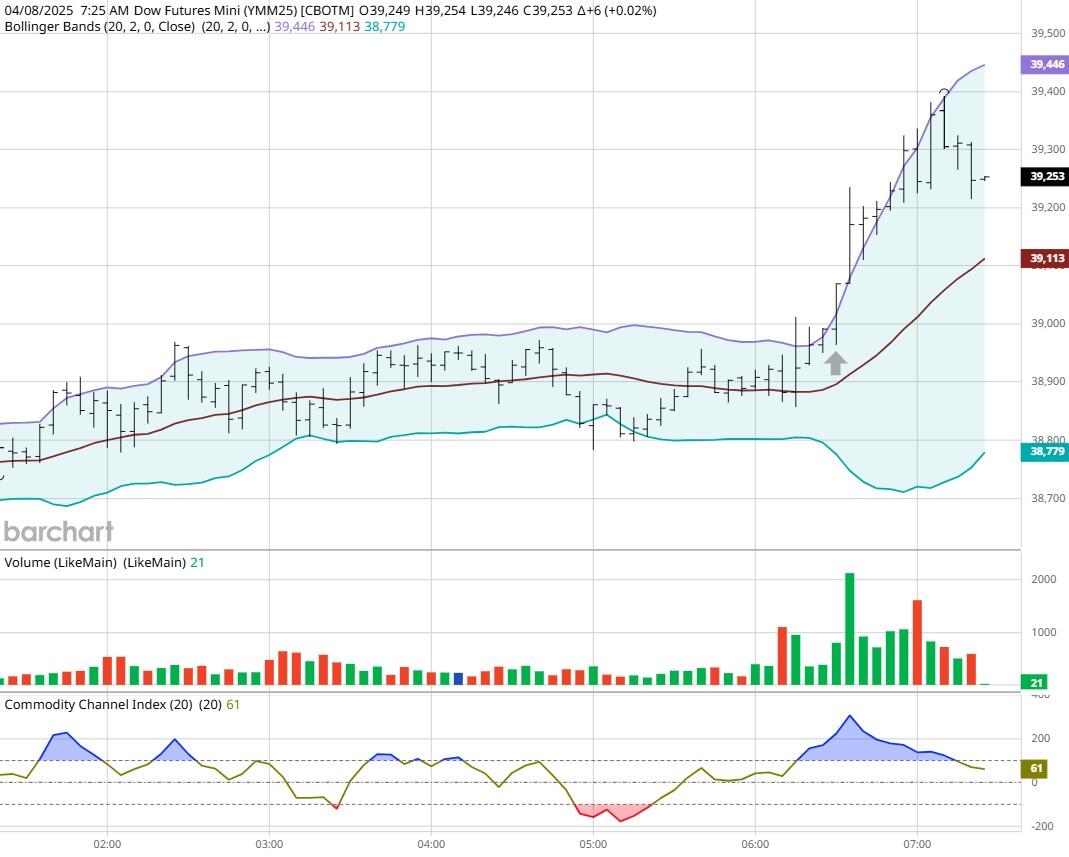
Dow - Mar 2025- 4/08/25
Bias
Yesterday we gave the markets an Upside bias as both the USD and the Bonds were down. The markets however had other ideas as the Dow dropped 320 points and the other indices closed Lower as well. Today we aren't dealing with a correlated market, and our bias is Neutral or Mixed.
Could this change? Of Course. Remember anything can happen in a volatile market.
Commentary
So yesterday the markets were poised to trade higher and initially they did with the Dow trading over 1,000 points Higher early in the session. Apparently, reality crawled back into the session as the Dow closed Lower by 320 points and the other indices closed Lower as well. So, what was the reality? China Import tariffs are being raised to 104 percent and that will have an impact on everyone. Want to learn Market Correlation and determine market direction hours before the Opening Bell?
Author

Nick Mastrandrea
Market Tea Leaves


