Fall in UK Retail Sales, USD refuses to weaken, The US stocks continue to underperform

Previous trading day events – 18 August 2023
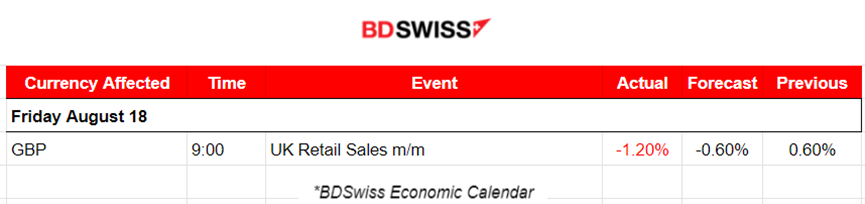
According to the U.K. retail sales data released on Friday, volumes are estimated to have fallen by 1.2% in July 2023 following a rise of 0.6% in June 2023 (revised from an increase of 0.7%). This was a bigger-than-expected decline in sales in July. Retailers indicated that the increased cost of living and food prices continued to affect sales. The pound weakened but not dramatically after the release.
"It was a particularly bad month for supermarkets as the summer washout combined with the increased cost of living meant sluggish sales for both clothing and food," Heather Bovill, deputy director for surveys and economic indicators at the Office for National Statistics (ONS), said. "Department store and household goods sales also dropped significantly."
"Our view is still that the growing drag on activity from higher interest rates will eventually generate a 0.5% peak to trough fall in real consumer spending," Ruth Gregory, deputy chief UK economist at Capital Economics, said.
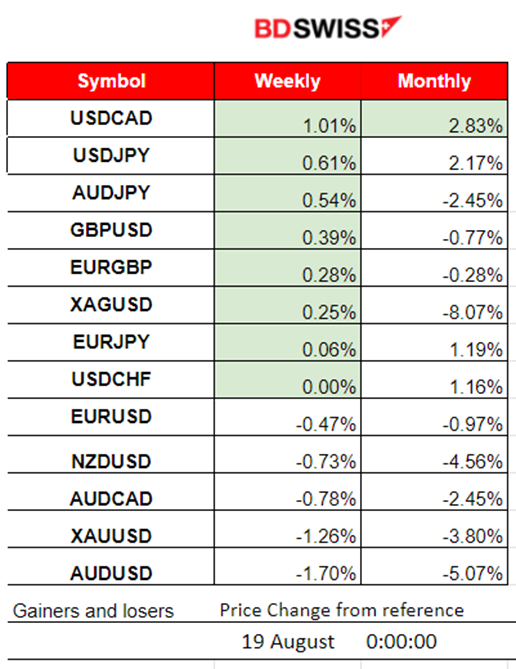
Winners vs losers
- USDCAD was leading last week with 1.01% gains. It is on the top of the month’s list too with 2.83% gains as well.
- USDJPY is following with 0.61% gains last week.
News reports monitor – Previous trading day (18 August 2023)
Server Time / Timezone EEST (UTC+03:00).
1. Midnight – Night session (Asian)
No important news announcements, no special scheduled releases.
2. Morning–Day session (European and N.American session)
The U.K. Retail Sales Change was actually negative, a decline that beat expectations causing the GBP to depreciate at the time of the release. GBPUSD fell more than 30 pips.
General verdict
-
Friday mood, more volatility for the GBP pairs because of the retail sales data.
-
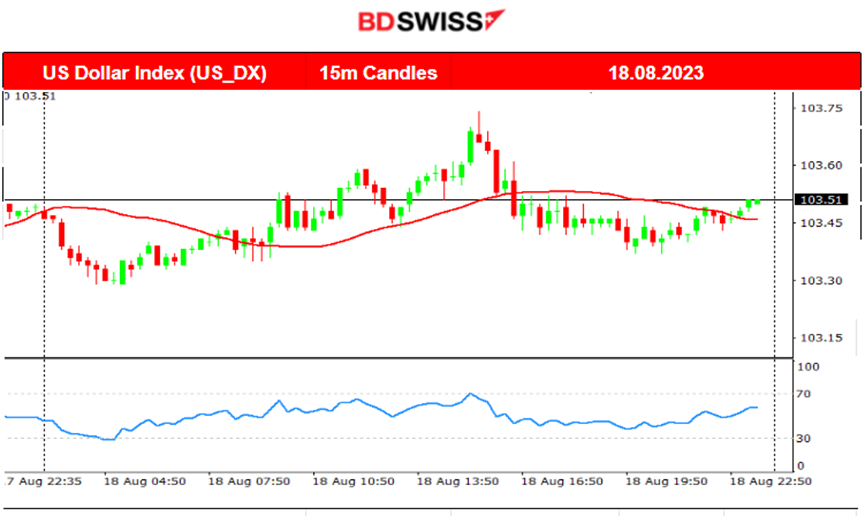
Not many scheduled important releases. USD remained on the same level, DXY moved sideways with low volatility.
-
High activity for Indices, they found resistance to the downside.
-
Oil moved higher.
Forex markets monitor
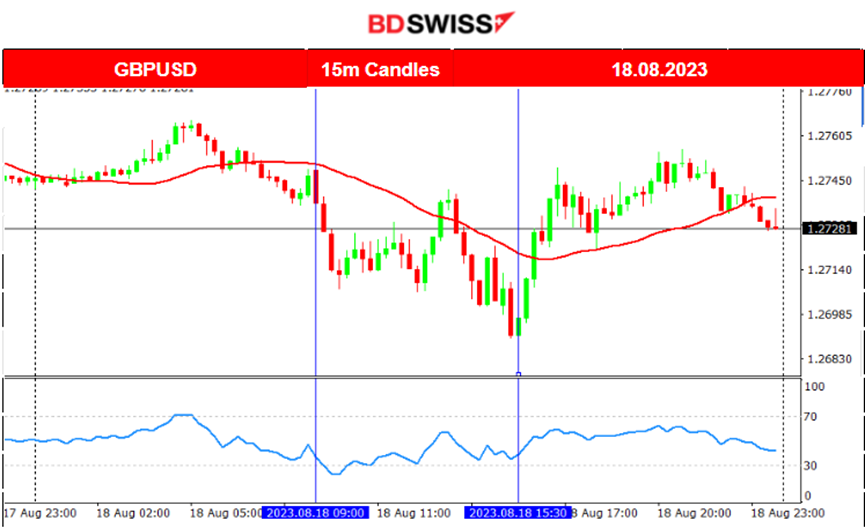
GBP/USD (18.08.2023) chart summary
Server Time / Timezone EEST (UTC+03:00).
Price movement
The volatility was higher for the GBPUSD. At the time of the retail sales data release at 9:00 the pair moved lower since the figure was actually a huge decline and the market reacted with GBP depreciation. It moved below the 30-period MA for a while finding support at near 1.26900 before eventually reversing. It continued during the N.American session to move above the MA and overall closing the trading day with an overall sideways path.
Equity markets monitor
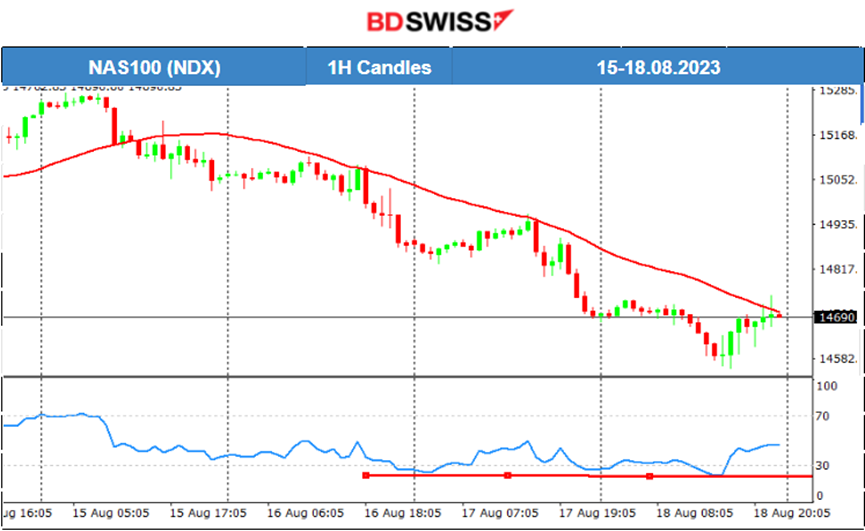
NAS100 (NDX) 4-day chart summary
Server Time / Timezone EEST (UTC+03:00).
Price movement
The U.S. stock market was hit recently by the Fitch and Moody’s Ratings causing it to crash intraday several times. The downturn continues as the market continues to underperform breaking important support levels. The index remains below the 30-period MA, moving steadily downwards. However, it might be a seasonal effect. After August, the price path could see drastic changes until the end of the year.
Commodities markets monitor
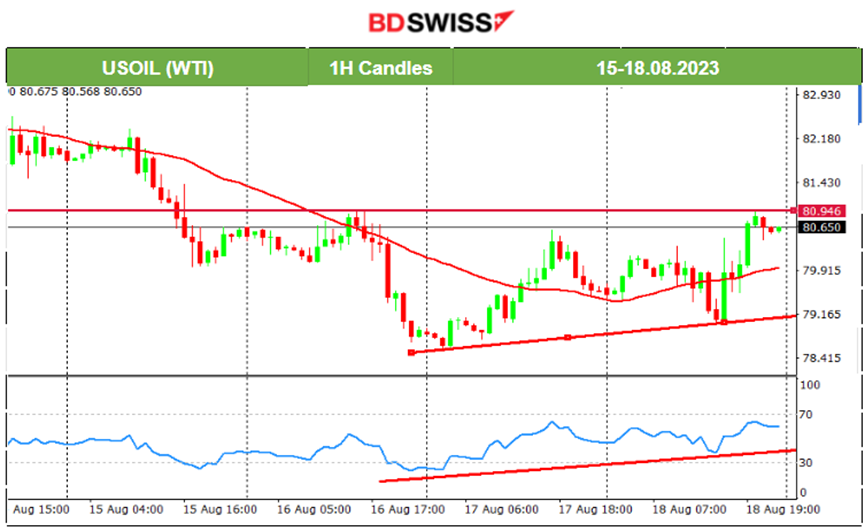
US Oil (WTI) 4-day chart summary
Server Time / Timezone EEST (UTC+03:00).
Price movement
The downward trend was short-term and it seems that it ended somehow. However, the 30-period MA has only now shown a slowdown and volatility is still expected to be high. The price was moving around the mean sideways indicating the end of the downward movement. It crossed the MA many times and remains on the upside. However the RSI does not form a bullish divergence. It only confirms the movement. For the price to move upwards significantly, it must break the level 80.95 USD/b. This will give us a better signal in regards to future price direction.
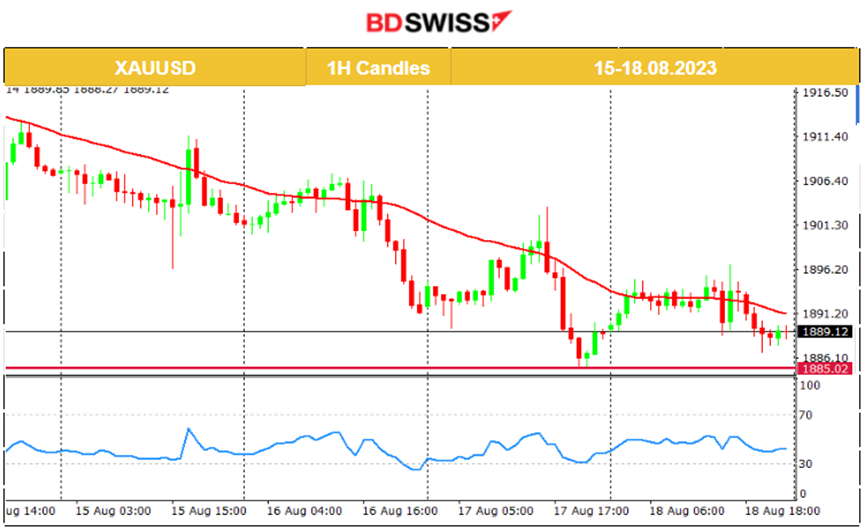
XAU/USD (Gold) 4-day chart summary
Server Time / Timezone EEST (UTC+03:00).
Price movement
As the USD is gaining strength, we see Gold moving lower and lower. A downtrend is apparent, the MA is obviously going down. It broke the 1900 USD/oz and even dropped until 1896 USD/oz before reversing quickly on the 15th of August. As the USD strengthened more, Gold dropped further to the strong support of 1890 USD/oz which broke and the price eventually moved even lower. Gold price broke further support levels on the 17th of August, reaching even the level 1885 USD/oz. No signs of reversing are apparent as the price still remains under the 30-period MA.
News reports monitor – today trading day (21 Aug 2023)
Server Time / Timezone EEST (UTC+03:00).
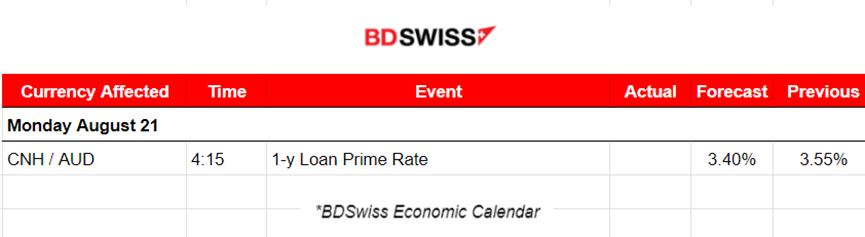
1. Midnight – Night session (Asian)
One report that might be interesting is the 1 year Loan Prime Rate. This is a benchmark lending rate set by the People's Bank of China. This figure might cause the market to react and the AUD pairs to be affected.
2. Morning–Day session (European and N.American session)
No important news announcements, no special scheduled releases
General verdict
-
Monday mood.
-
Absence of important scheduled releases. No expecting shocks.
-
Low volatility, only indices might see some activity after 16:30, NYSE opening.
Author

BDSwiss Research Team
BDSwiss
BDSwiss is a leading financial institution, offering bespoke CFD trading and investment products to more than 1.7 million registered clients, in over 180 countries.