|

EWC long term Elliott Wave uptrend and cycles

Firstly the EWC instrument inception date was 3/12/1996. The Canada ETF seeks to track the investment results of an index composed of large and mid-sized companies in Canada. This is of course reflected in the price. The best Elliott Wave reading of the long-term cycles presume some lower prices that did not exist prior to the ETF fund inception date.

As shown on the monthly chart, the bullish cycle from all-time lows is believed to have ended in November 2007. This is mostly in line with many other broad-based ETFs and indices that ended larger cycles near that time. Likewise, the steep pullback lower into the March 2009 lows replicated the pullbacks in other ETF & indices instruments. This pullback was strong enough to suggest it had corrected the cycle up from the all-time lows. The analysis and commentary continue below the monthly chart.

EWC

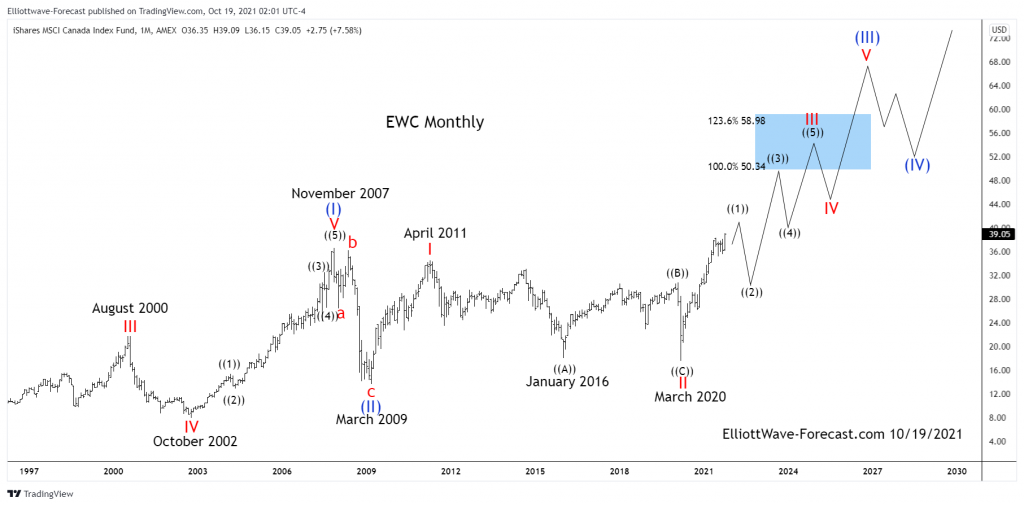
Secondly, the bounce from the March 2009 lows has now got back above the November 2007 highs. However, compared to other indices instruments it is lagging. That’s not to say it will not catch up it is just the way it works out. EWC bounces higher as related indices instruments are going higher. However as of lately at a slower pace. Similarly, the instrument corrects cycles in pullbacks lower when the related instruments are doing the same.

The analysis and conclusion as mentioned earlier; Price has got above the November 2007 highs as the above chart shows. The cycles remain bullish nearer-term while pullbacks remain above the March 2020 lows. The instrument should proceed higher with the related other countries' ETFs and indices reflecting the improvements in the progression of mankind.

Author

Elliott Wave Forecast Team

Elliott Wave Forecast Team

ElliottWave-Forecast.com

More from Elliott Wave Forecast Team
Share:

Editor's Picks

EUR/USD hits two-day highs near 1.1820

EUR/USD picks up pace and reaches two-day tops around 1.1820 at the end of the week. The pair’s move higher comes on the back of renewed weakness in the US Dollar amid growing talk that the Fed could deliver an interest rate cut as early as March. On the docket, the flash US Consumer Sentiment improves to 57.3 in February.

GBP/USD reclaims 1.3600 and above

GBP/USD reverses two straight days of losses, surpassing the key 1.3600 yardstick on Friday. Cable’s rebound comes as the Greenback slips away from two-week highs in response to some profit-taking mood and speculation of Fed rate cuts. In addition, hawkish comments from the BoE’s Pill are also collaborating with the quid’s improvement.

Gold climbs further, focus is back to 45,000

Gold regains upside traction and surpasses the $4,900 mark per troy ounce at the end of the week, shifting its attention to the critical $5,000 region. The move reflects a shift in risk sentiment, driving flows back towards traditional safe haven assets and supporting the yellow metal.

Crypto Today: Bitcoin, Ethereum, XRP rebound amid risk-off, $2.6 billion liquidation wave

Bitcoin edges up above $65,000 at the time of writing on Friday, as dust from the recent macro-triggered sell-off settles. The leading altcoin, Ethereum, hovers above $1,900, but resistance at $2,000 caps the upside. Meanwhile, Ripple has recorded the largest intraday jump among the three assets, up over 10% to $1.35.

Three scenarios for Japanese Yen ahead of snap election

The latest polls point to a dominant win for the ruling bloc at the upcoming Japanese snap election. The larger Sanae Takaichi’s mandate, the more investors fear faster implementation of tax cuts and spending plans. 

XRP rally extends as modest ETF inflows support recovery

Ripple is accelerating its recovery, trading above $1.36 at the time of writing on Friday, as investors adjust their positions following a turbulent week in the broader crypto market. The remittance token is up over 21% from its intraday low of $1.12.