Everyone is a genius after the fact

S2N spotlight
Let me walk you through the reality of investing.
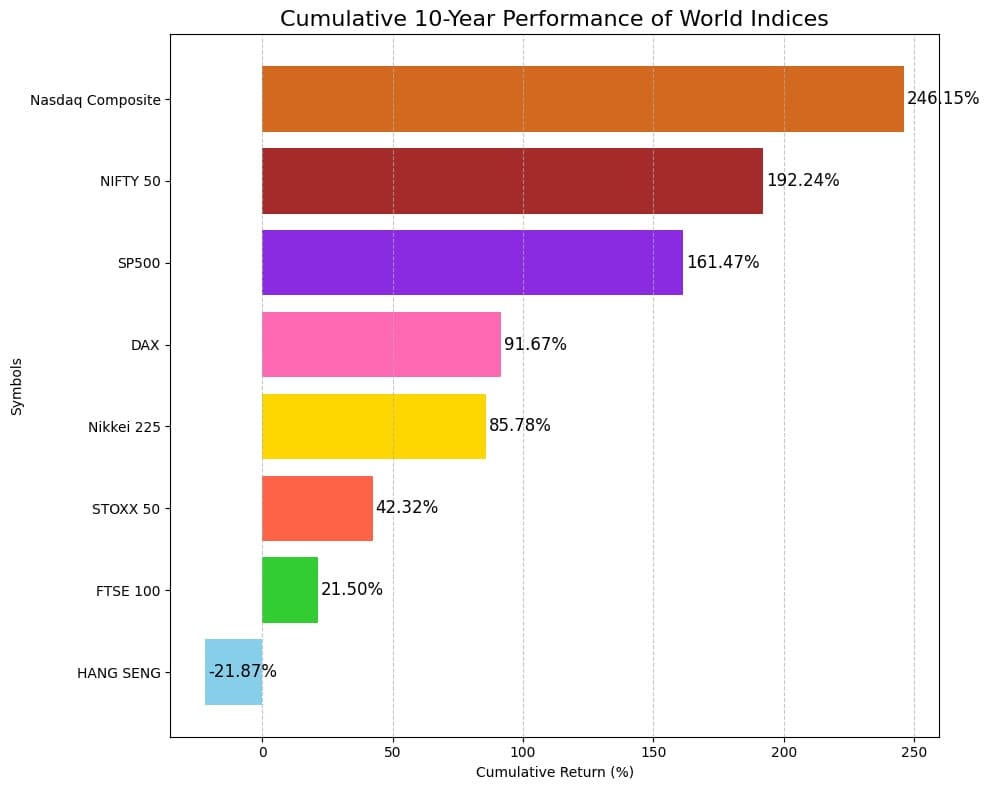
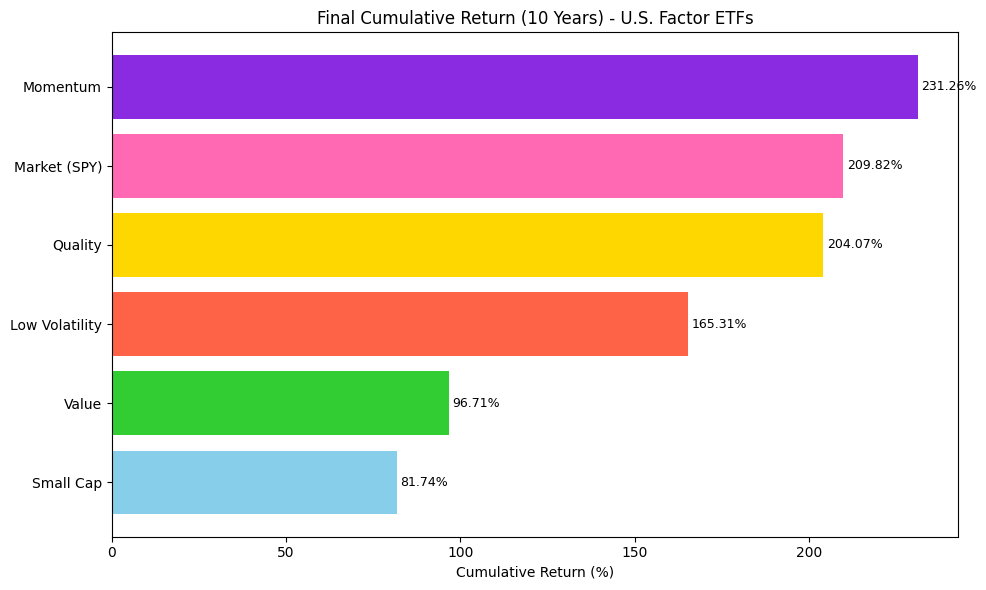
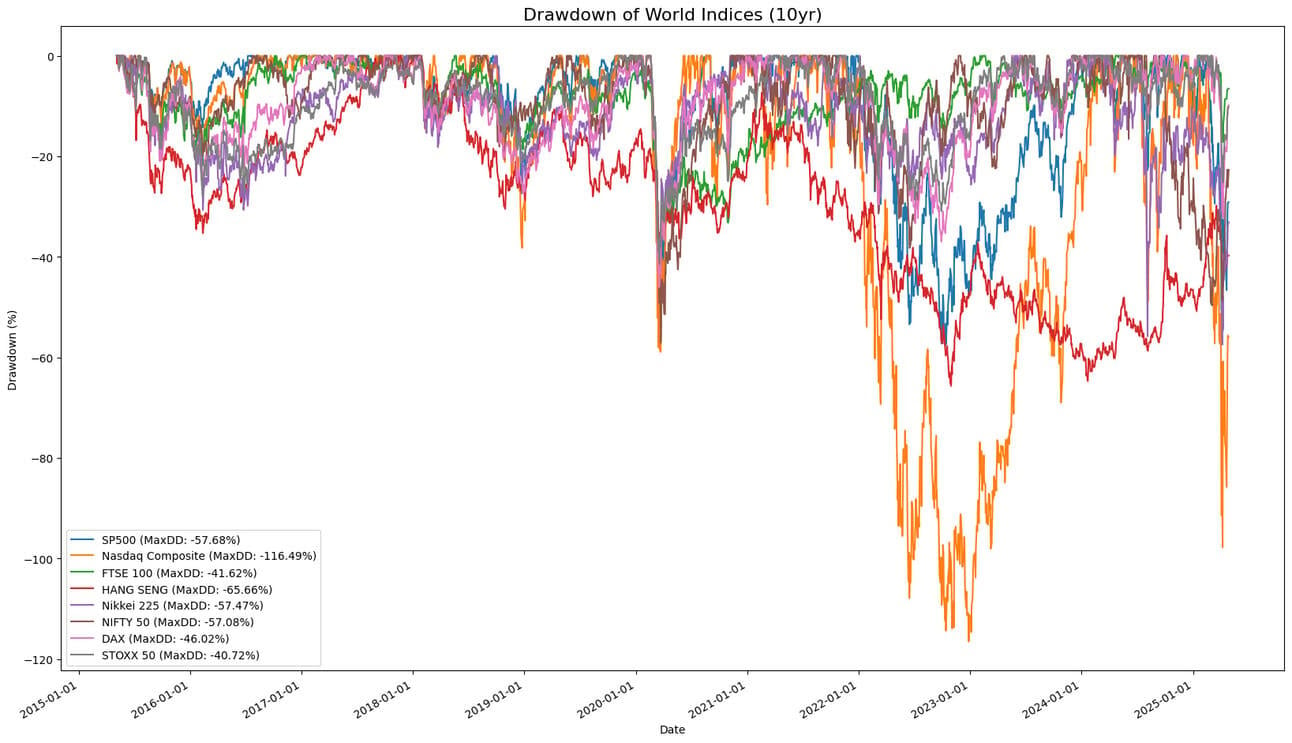
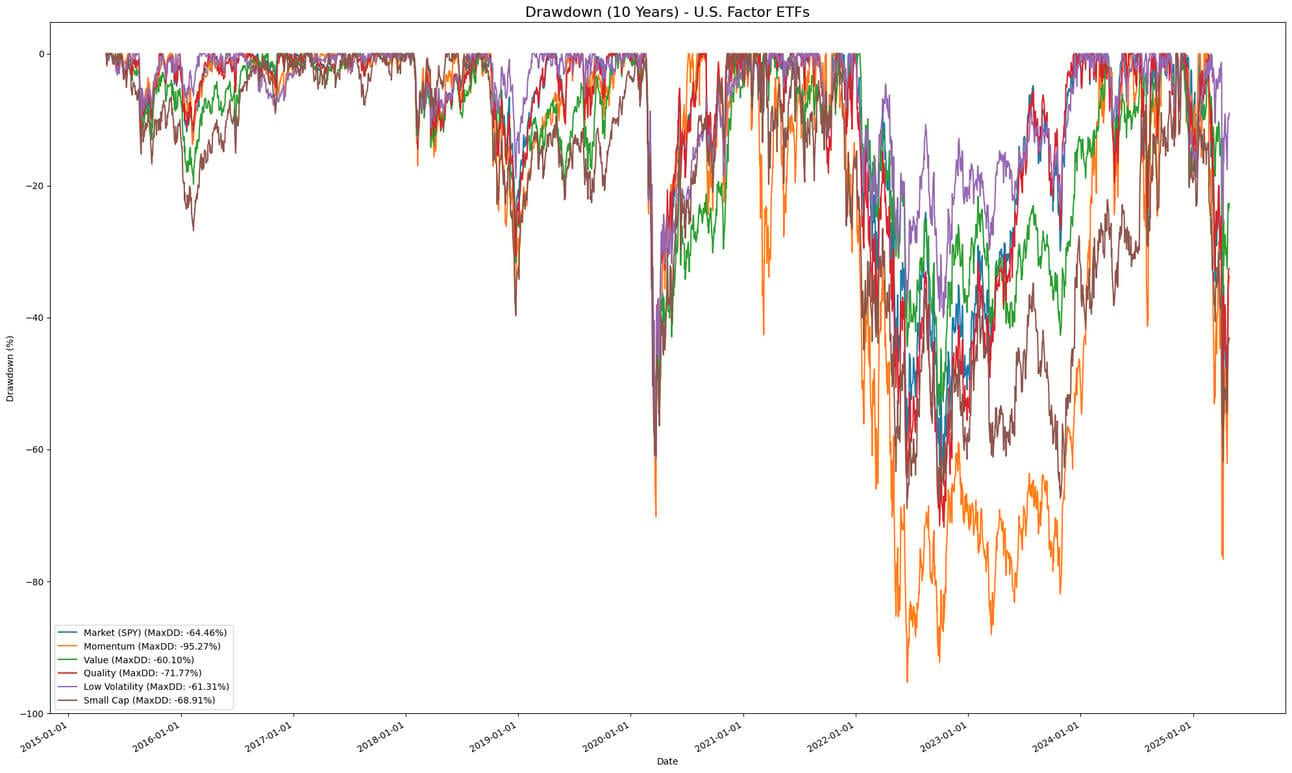
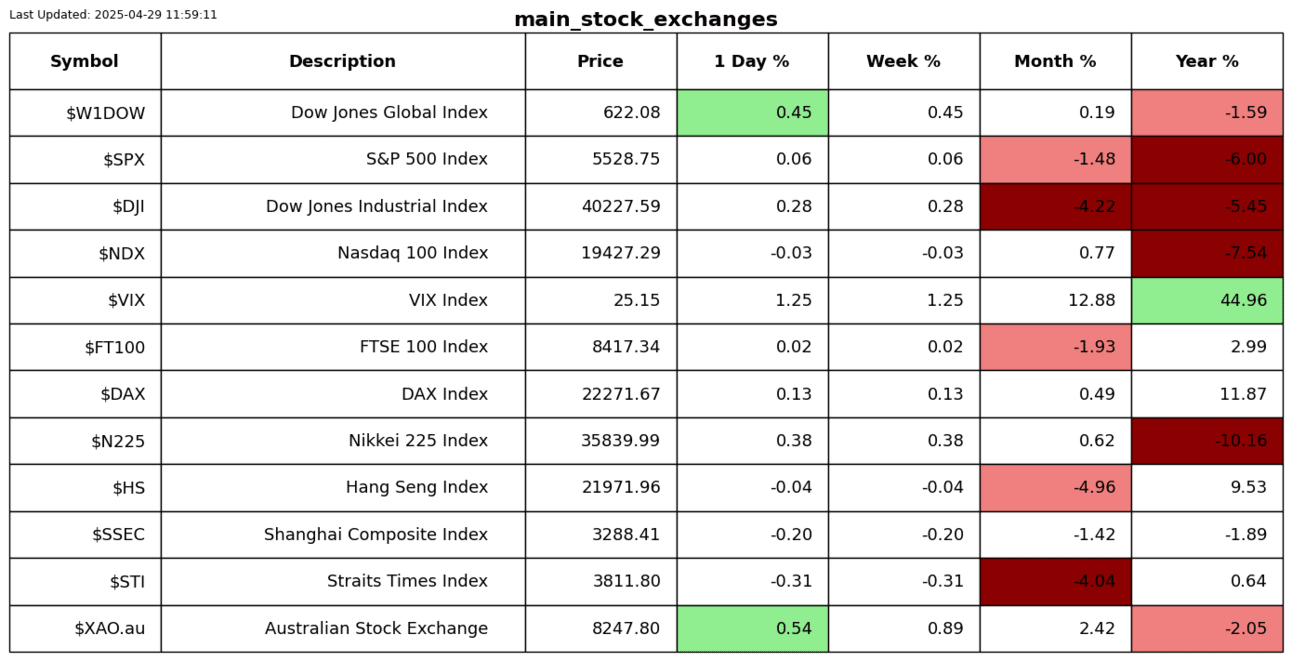
I am going to present the 10-year performance of the major world indices and the factors driving the US stock market. I could pick any two examples, but I think these ones are quite relatable.
We start by looking at the cumulative performance of the different symbols or factors as one data point. This is how we often encounter the data; it could be a sound bite or a number in the newspaper. We typically react by thinking, why didn’t I invest in that or invest more, it was so obvious!
If we are a little more sophisticated, we will look at a chart of the performance. Once again, most of us will look at these charts that I call the Price Journey and think, I should have definitely invested more in the Nasdaq or Momentum. It is like we have a blind spot to the risks involved. They call it hindsight bias; it is real.
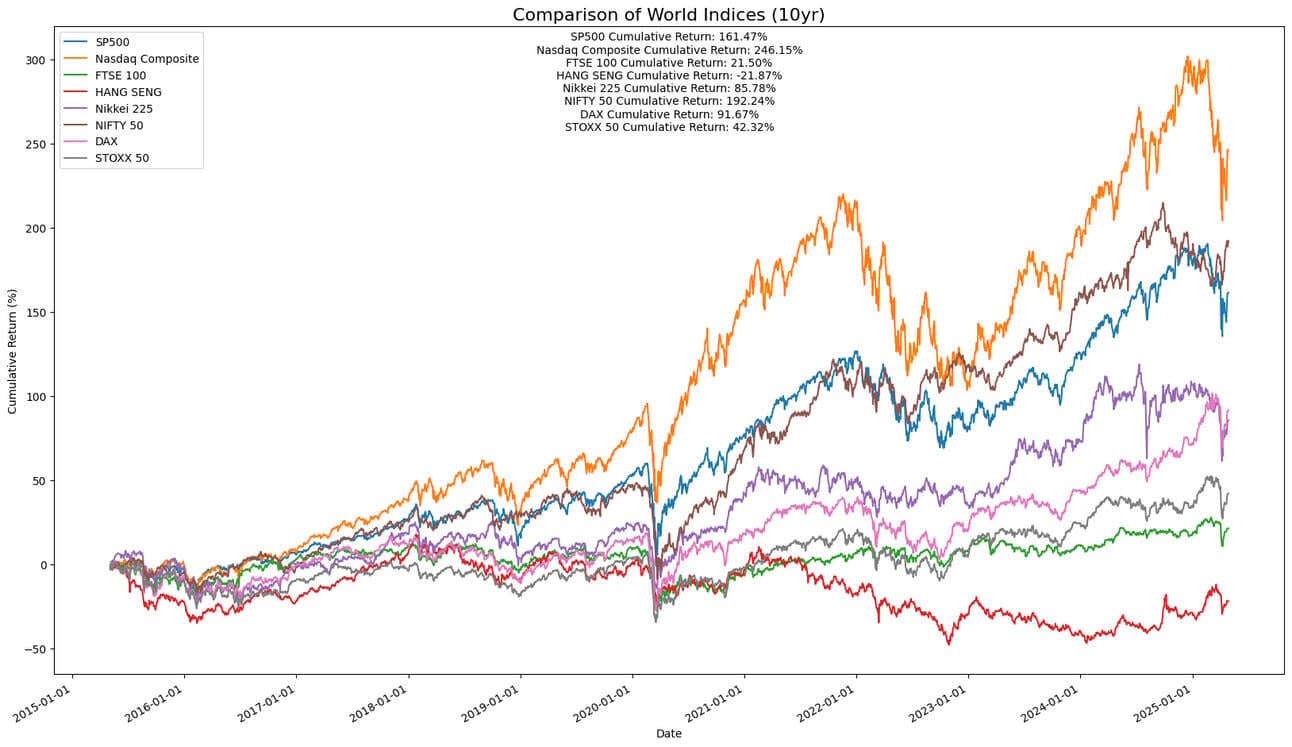
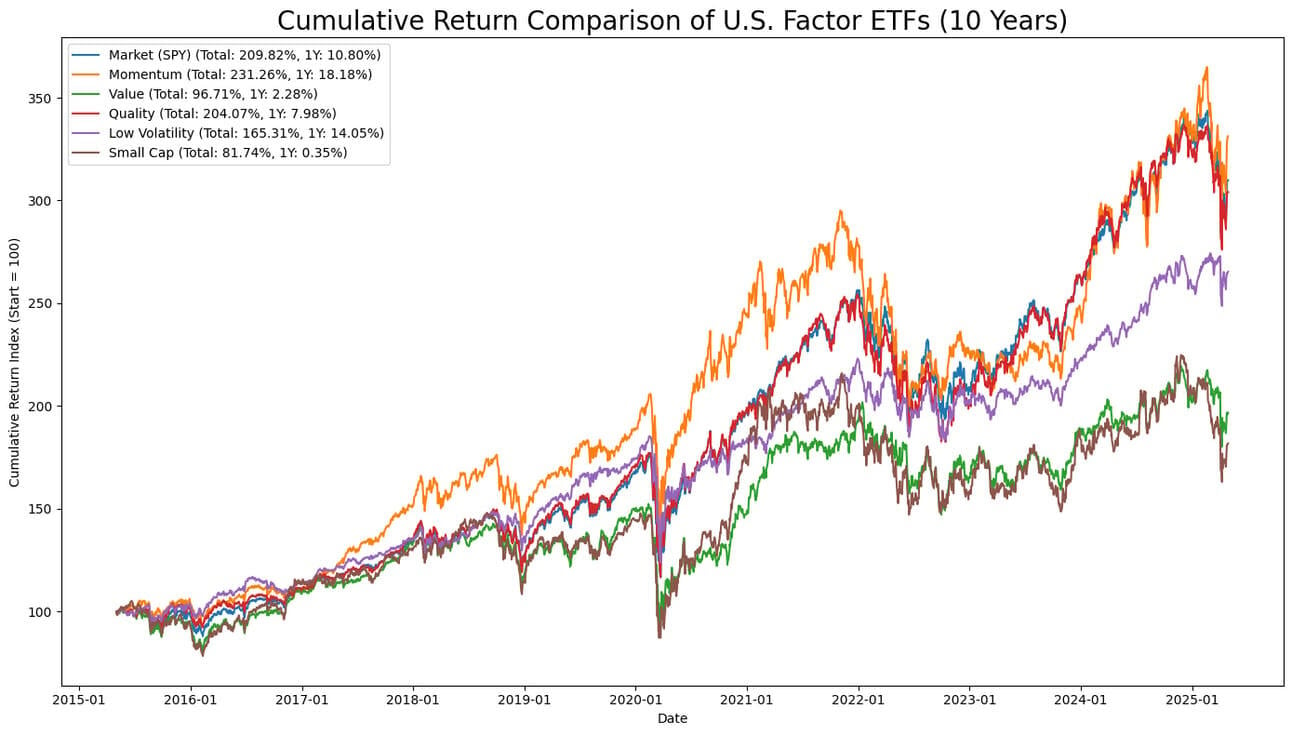
Most of the internal chatter is driven by the benefit of hindsight. What we miss is that the top performers had huge drawdowns, a fact we tend to skip. There are very few investors who would have held on without knowing the future, which is unknowable. During the journey into the depth of the drawdown, I am pretty sure the anxiety of those invested in the best-performing assets went through the roof. Most would have folded at the worst possible time. Nobody focuses on the hell that comes with being right and surviving.
Before you tell me there is an error with my drawdown calculations, as in how can there be more than 100% DD, the answer is simple. The code is looking through the last 10 years, and the Nasdaq made an all-time high before the 10-year window.
The point I am trying to make with today’s Spotlight is to stop chasing unrealistic goals and be satisfied chasing a higher probability goal. We read about the top-performing hedge fund managers or the highest-paid sportsmen or actors and think that we could also achieve this. We need to accept that these people represent 0.05% of the pool competing. We should definitely be inspired by these people, but we should not attach unrealistic probabilities to achieving similar success, as therein lie the seeds to failure. It is the same with these outperformers in the data I have presented. The chances are very small that we would have had the balls to hold through all the pain, and it may not be that smart to do anyway. I can assure you the probabilities of coming back from a large drawdown, i.e., more than 50%, are very small. These are small sample sizes of success. Combine 2 investments with a 50% drawdown
S2N observations
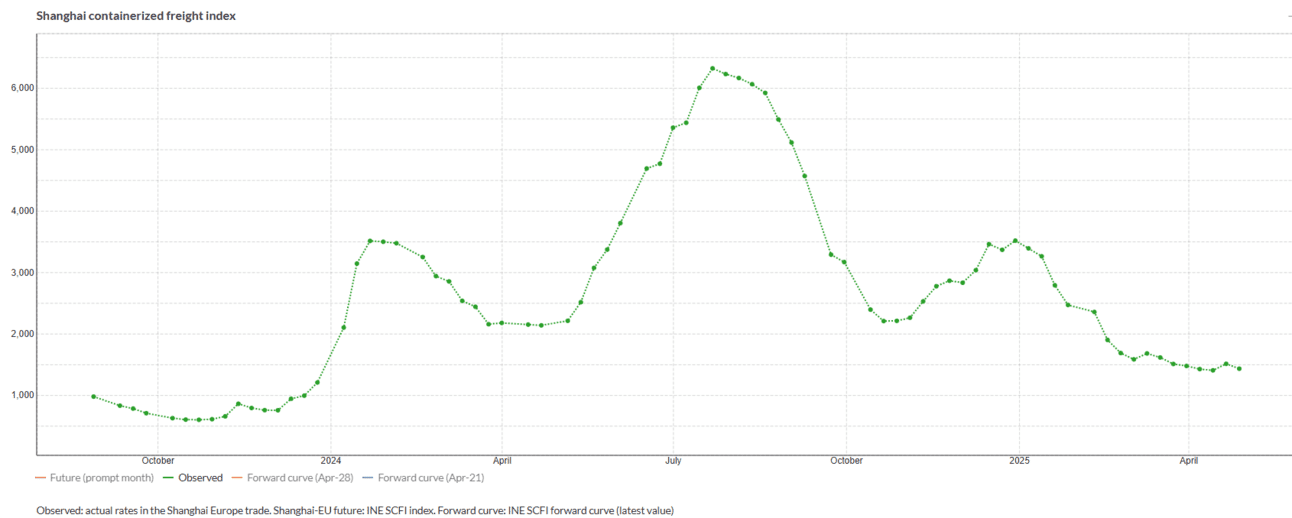
Yesterday I spoke about the lag effect with corporate earnings and economic data releases. I have access to some “real-time” economic data; one of them is the Shanghai Containerised Freight Index (SCFI).
Think of the SCFI as the “spot price thermometer” for moving a container out of China’s busiest port. When it spikes, shippers are paying up for scarce space; when it slumps, carriers are cutting rates to fill boxes. Because it updates weekly and is highly route-specific, it’s the index analysts quote first when gauging short-term swings in global freight costs.
As you can see, this index has been coming down. I suspect that China will experience an economic slump with many layoffs, despite the deals they do with Europe, Asia, and Russia. This will affect the US economy as well. Expect poor numbers in the months to come.
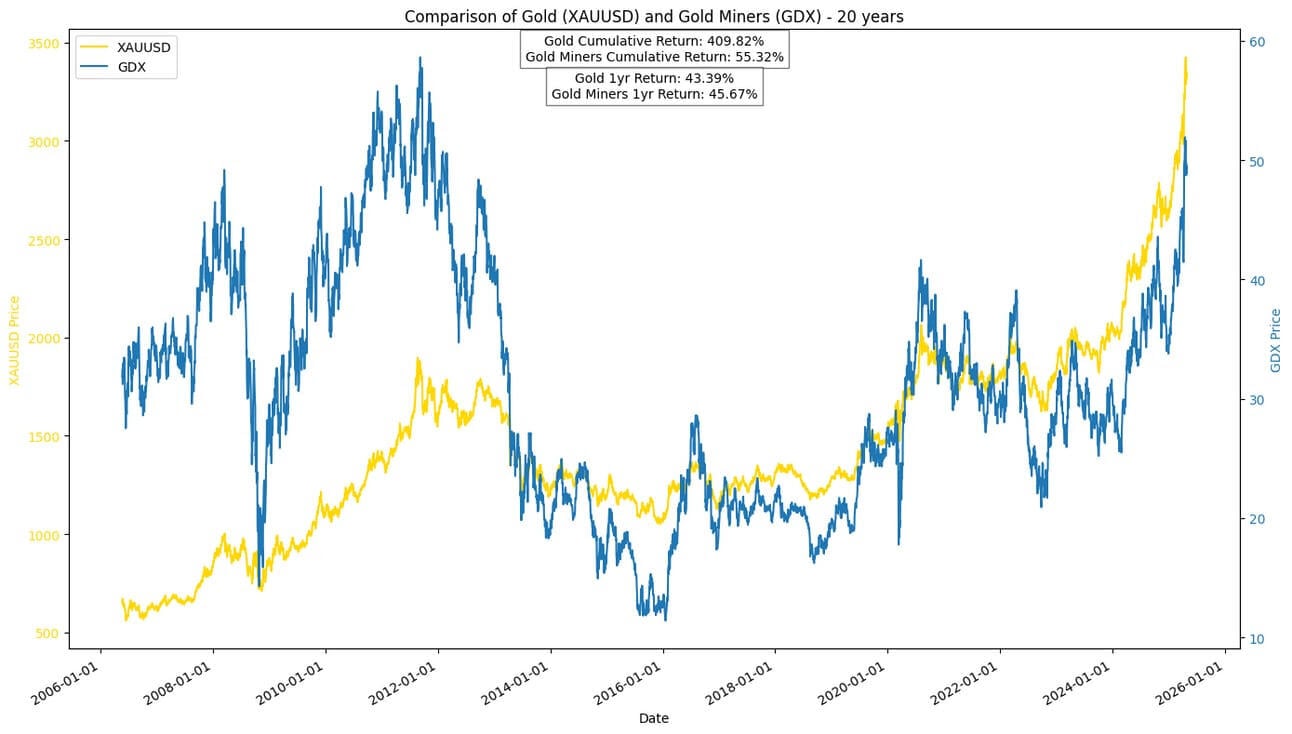
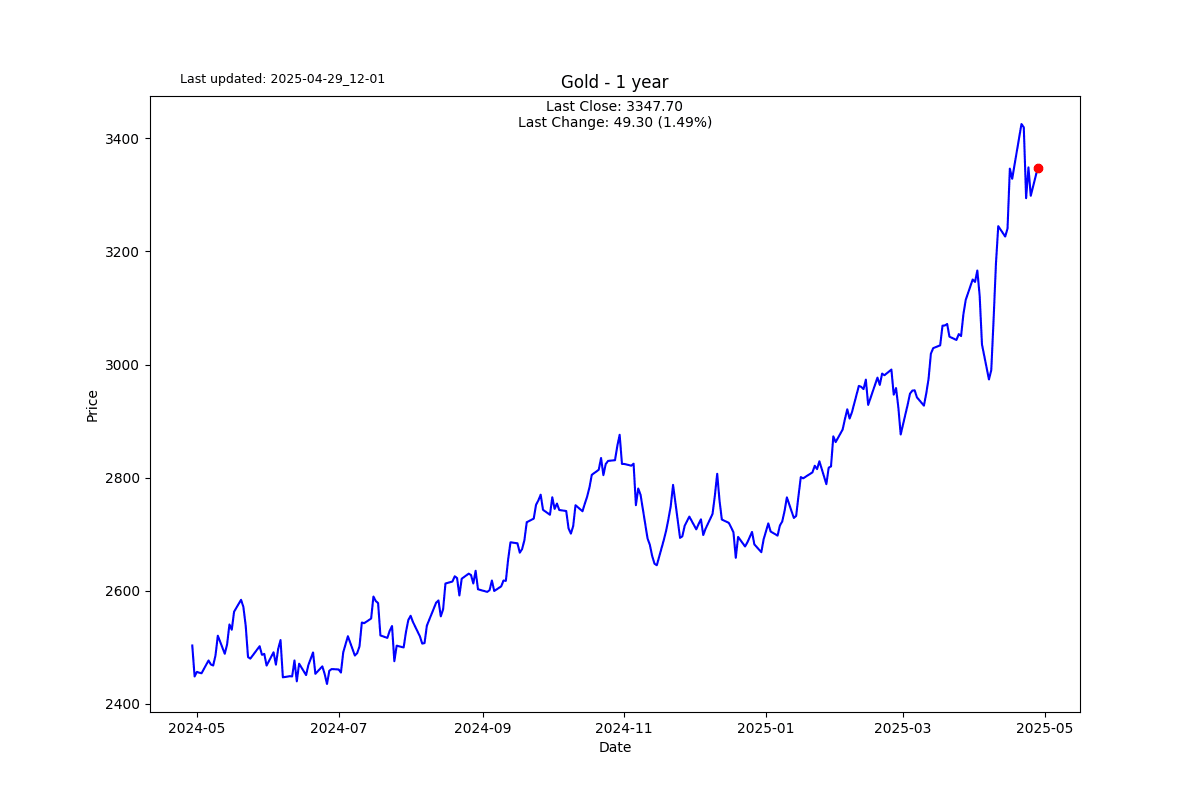
I recently read a report that John Paulson, who famously made $4 billion for himself with his subprime bet, has been punting big on gold. He was early, and his funds suffered. He is managing his own money these days and does not hold any physical gold. He is all about owning the miners to get the maximum bang for his buck. I think it is a very smart move, as miners are still well below their previous all-time high 13 years ago and move a lot more. They are like having call options without the time decay. I will be adding this to my trade ideas.
I want to share part of a transcript from a podcast I listened to with Adam Taggart interviewing Brent Johnson. I had never heard of Brent before this talk and found his interpretation of things refreshing. He sees things a bit differently from me and most economists, but what he says makes a lot of sense. Here is a short snippet.
History rarely gives advance notice that it is laying down a marker. Empires do not typically hold press conferences when they change the rules. Superpowers do not typically send warnings before they weaponize the system they built. And yet — America is telling the world exactly what is coming.
This is not the chaos of decline. This is not the flailing of a fading empire. This is the world’s dominant power consolidating its control — unapologetically, aggressively, and with the full weight of its economic engine behind it.
And the playbook is not subtle.
The Trump Administration has thrown out the ivory tower frameworks of globalization, free trade, and rules-based cooperation — and replaced them with something far older, simpler, and more ruthless:
Tariffs are not policy details — they are pressure points. Supply chains are not economic abstractions — they are leverage. And foreign governments and multinational CEOs are not partners — they are counterparties in a zero-sum contest for control.
Access to the American market — the largest, wealthiest, and most consumption-driven in human history — is no longer free. It will come with a price.
But power moves like this do not come without consequences. Global capital is shifting. Markets are trembling. Foreign holders of U.S. assets — lulled for decades by predictability and privilege — are discovering that what the U.S. giveth, the U.S. can taketh away.
This is not about trade policy. And it is not about tariffs.
It is about power — who has it, who does not, and what happens when the world’s largest economy decides to stop pretending otherwise.
There is a lot to unpack here. Until next time.
S2N screener alert
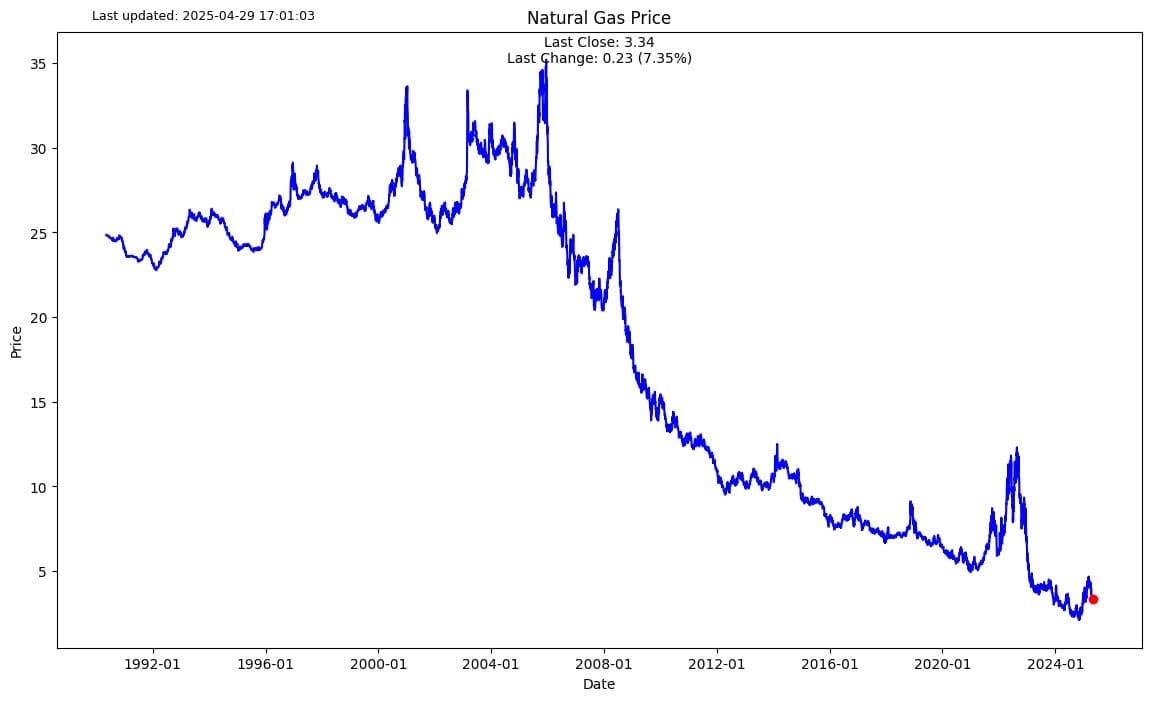
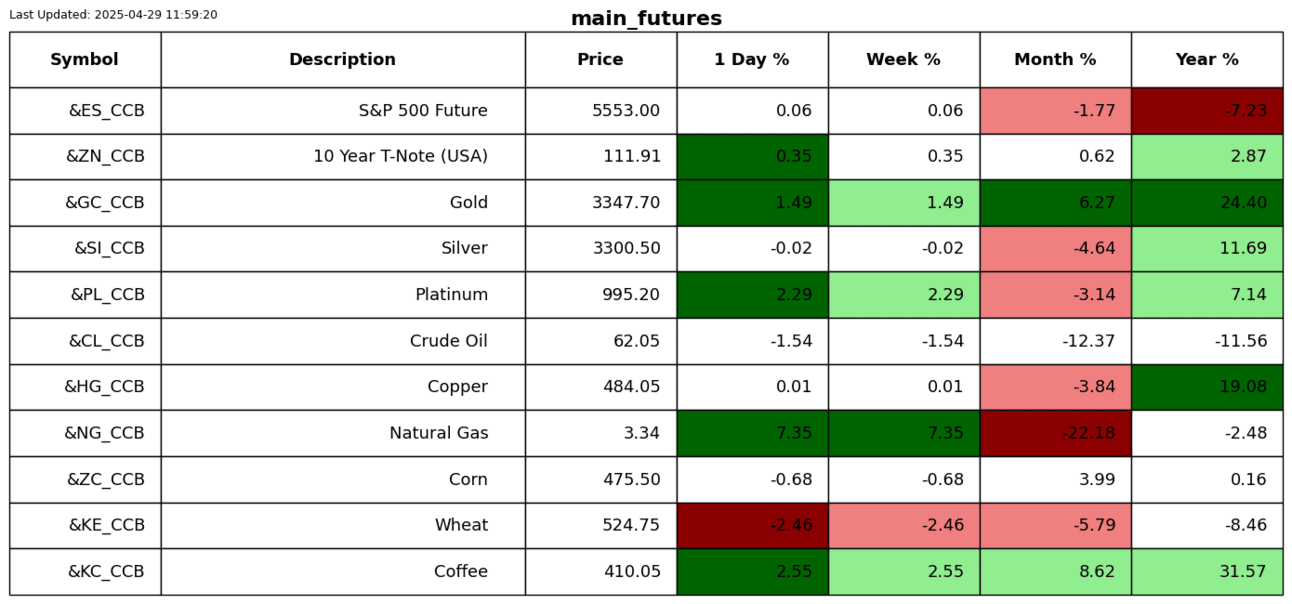
Frankly, I don’t know what is going on with natural gas. I get a Z-score alert almost every day. Yesterday was a +5 Z-score, only the 98th time.
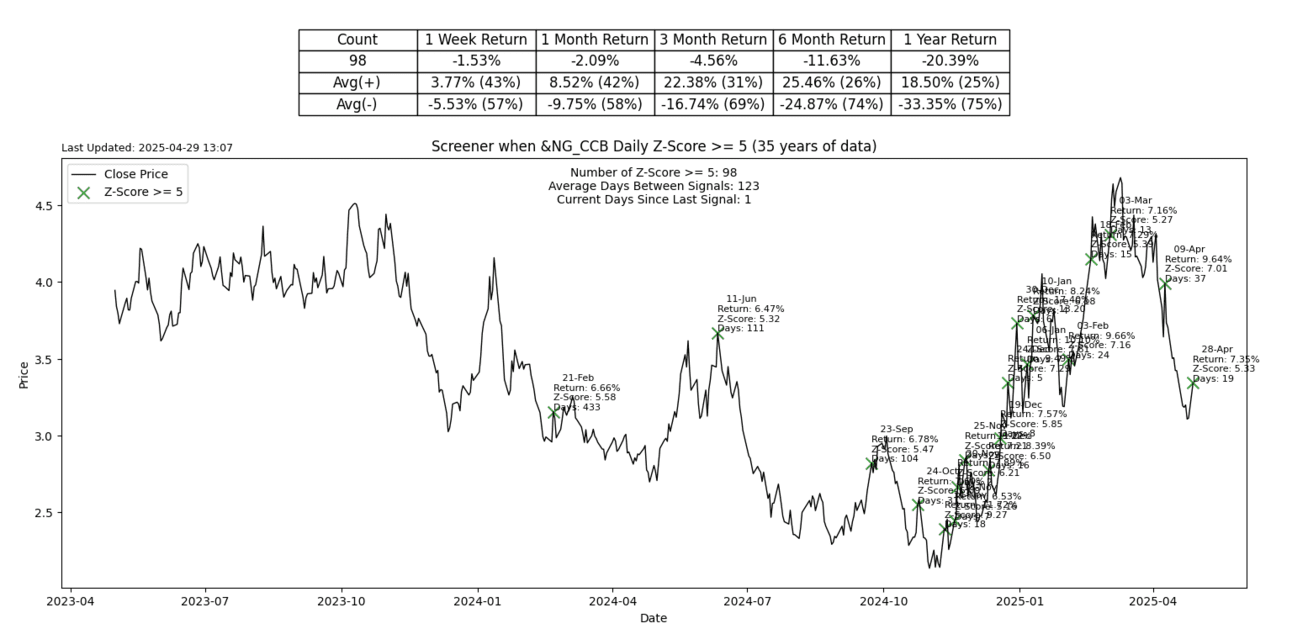
To try and get a better perspective, I am looking at a chart of natural gas futures with a lot of history. Good golly, prices have come down a lot since the highs of the GFC.
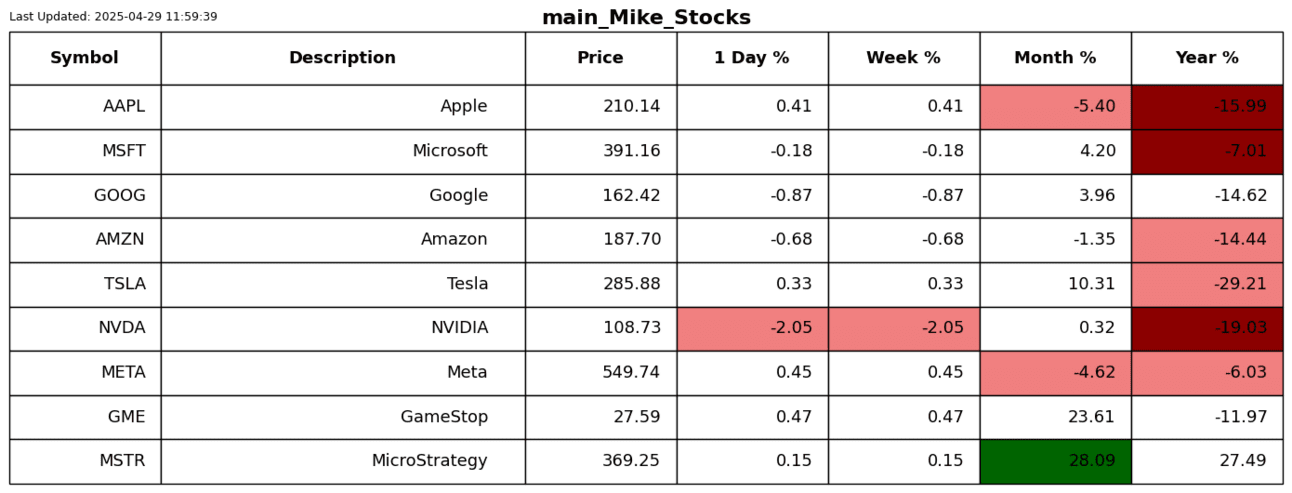
S2N performance review
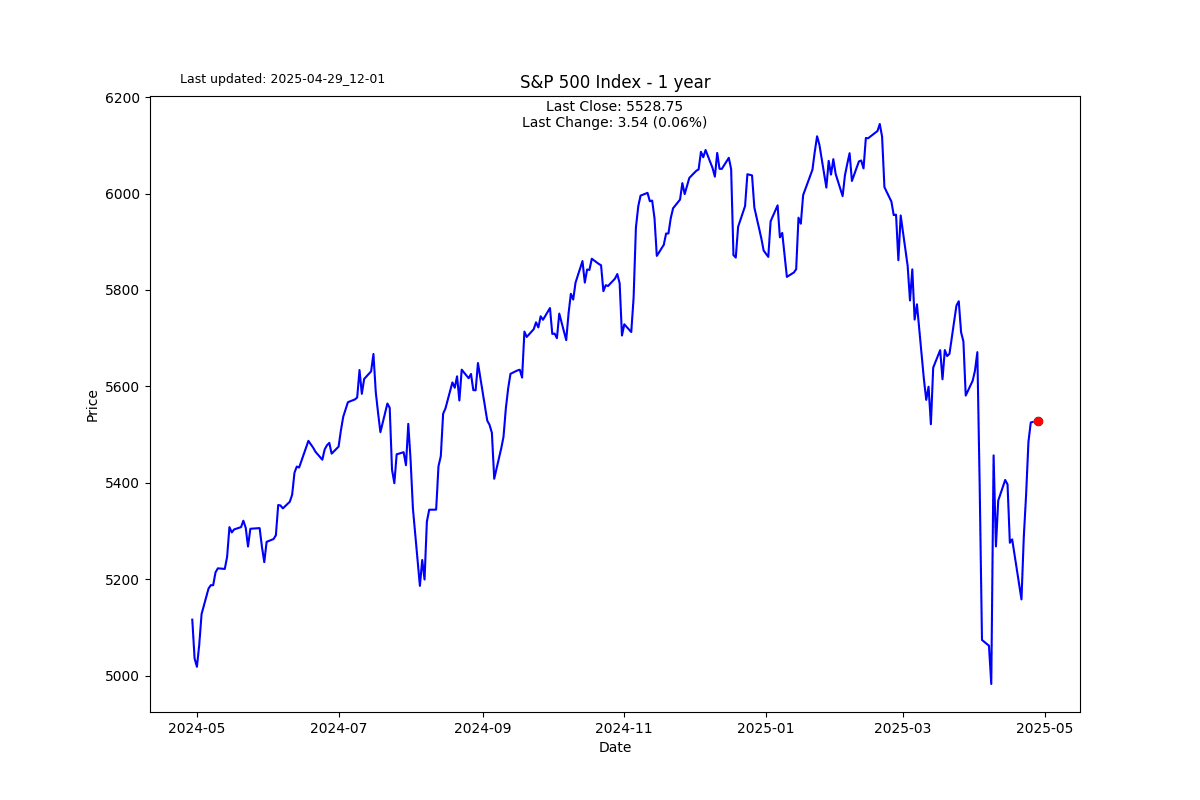
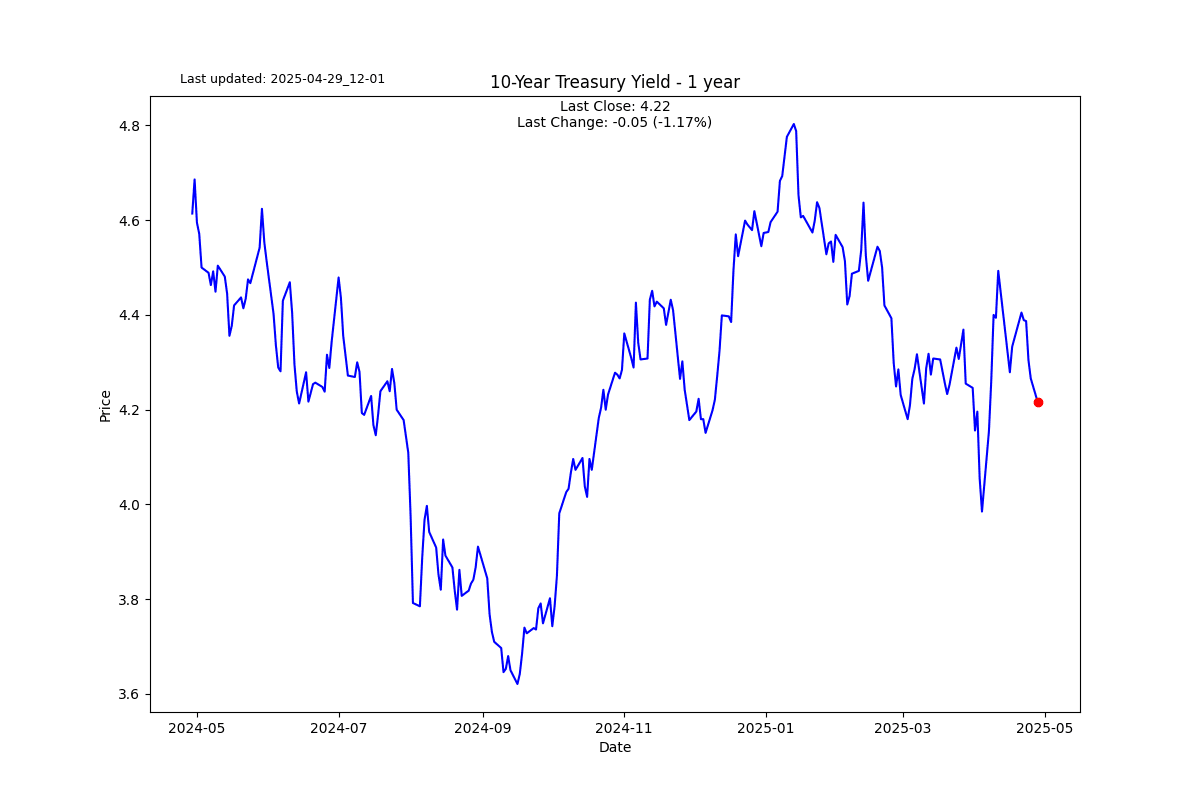
S2N chart gallery
S2N news today
Author

Michael Berman, PhD
Signal2Noise (S2N) News
Michael has decades of experience as a professional trader, hedge fund manager and incubator of emerging traders.


