EUR/USD tests key resistance trendline, gold finds resistance around 200-day SMA [Video]
![EUR/USD tests key resistance trendline, gold finds resistance around 200-day SMA [Video]](https://editorial.fxstreet.com/images/Markets/Currencies/Majors/EURUSD/photo-of-the-american-and-euro-banknotes-57153806_XtraLarge.jpg)
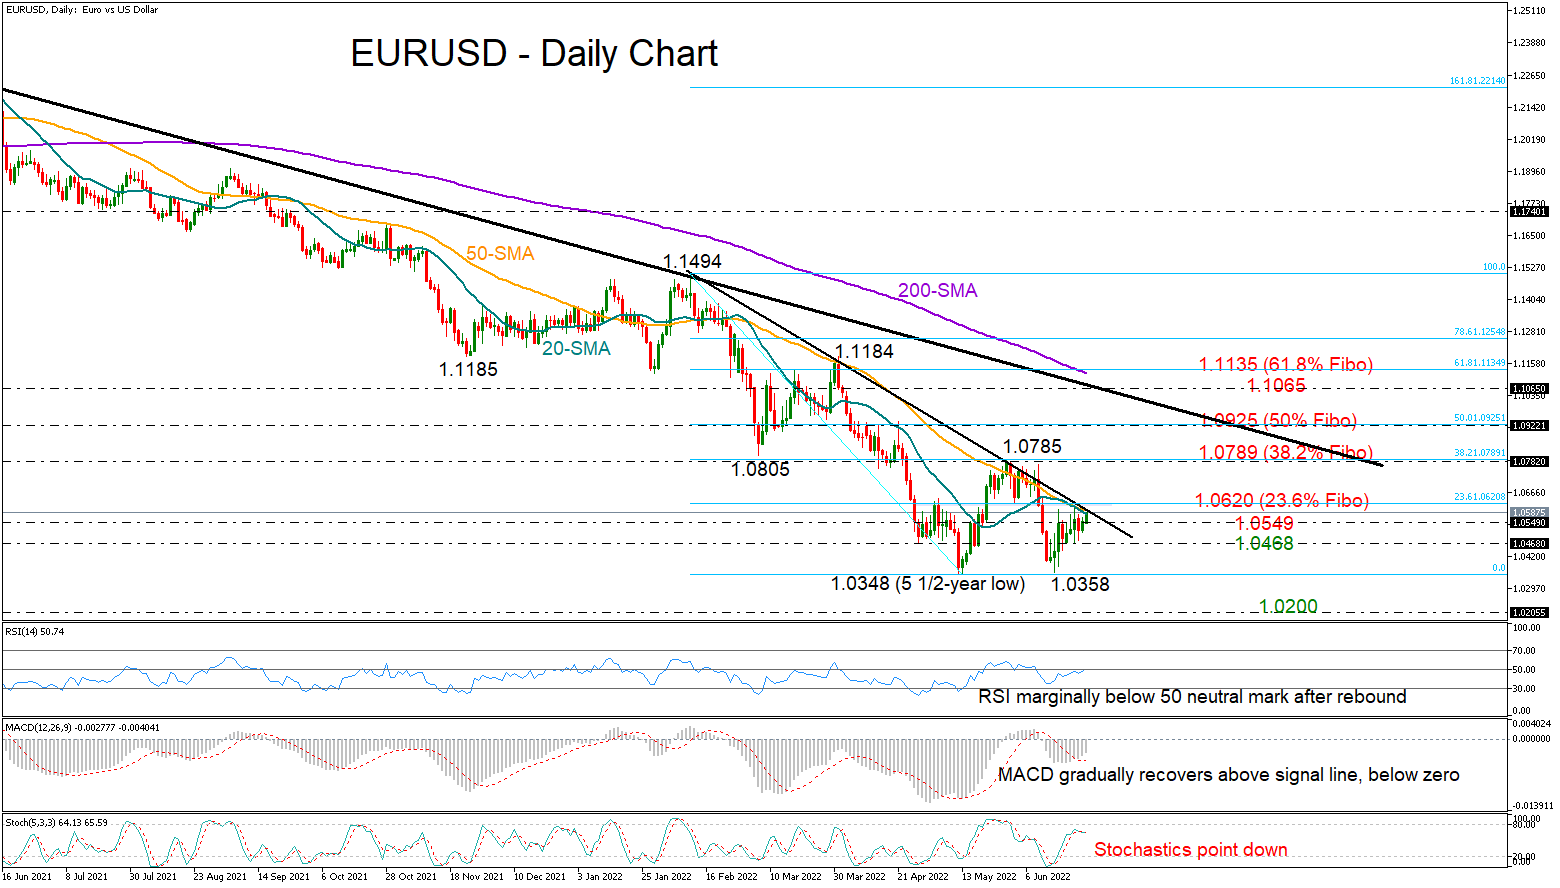
EUR/USD tests key resistance trendline; bias neutral-to-bearish
EURUSD opened the week with a muted tone, consolidating its rebound off 5½-year lows marginally below the tough resistance trendline drawn from the 1.1494 high and its shorter-term simple moving averages (SMAs) around 1.0580.
The upside reversal in the RSI and the MACD’s slow improvement above its red signal line is sending some positive vibes about short-term trading, though as long as the indicators hover in the bearish area, downside risks remain intact. The stochastics are setting a bearish intersection following their latest upleg, mirroring fading buying appetite as well.
Slightly above the trendline, the 23.6% Fibonacci retracement of the 1.1494 – 1.0348 downleg might prove another struggle for the bulls at 1.0620. Therefore, traders may wait for a durable extension above that bar before targeting the 38.2% Fibonacci of 1.0789 and May’s swing high. Running higher, the pair will need to claim the 50% Fibonacci of 1.0925 to gain direct access to the longer-term trendline at 1.1065 and the 61.8% Fibonacci of 1.1135. Strikingly, the falling 200-day SMA is located within the same region.
Alternatively, should the pair lose the battle at 1.0549 and correct lower, it could immediately find some footing around the 1.0459 restrictive area. Failure to bounce here would bring the double bottom around 1.0348 next into consideration. Any violation at this point is expected to extend the more-than-a-year old series of lower lows towards the 1.0200 psychological level.
In brief, EURUSD is reflecting a neutral-to- bearish bias in the short-term picture. A move above 1.0620 or below 1.0459 could navigate the market accordingly.
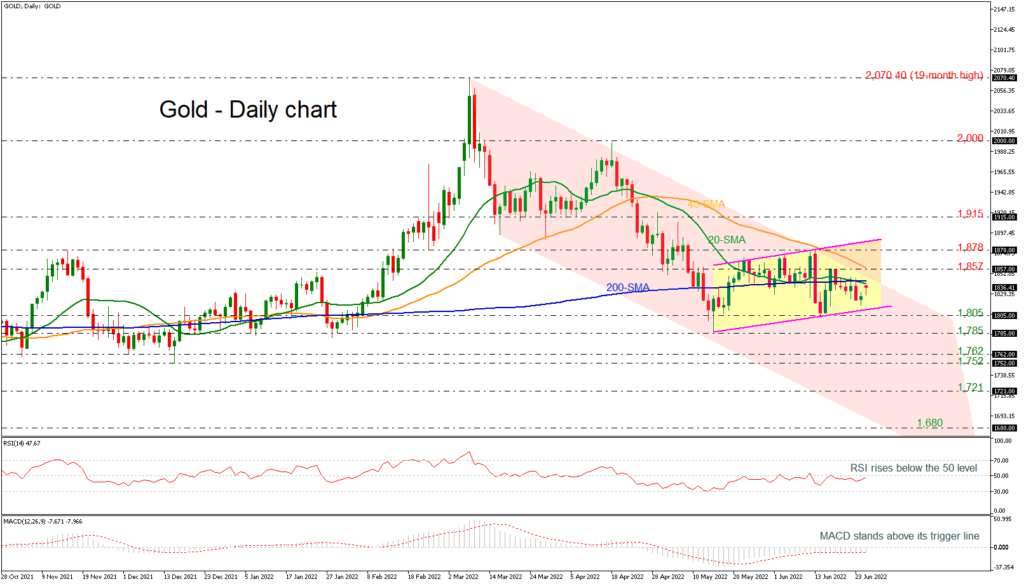
Gold finds resistance around the 200-day SMA within upward sloping channel
Gold have developing slightly higher over the last five weeks, holding within an upwardly sloping channel.
The price opened with a positive gap earlier in the day, remaining marginally below the 200-day simple moving average (SMA), while the RSI and the MACD provide little direction about the next move in the price as the former is heading up below its 50 neutral mark and the latter remains stable within the negative territory.
If buyers break through the 1,857 barrier and the 50-day SMA, the next challenge could come from the area between the 1,878 barrier and the top of the short-term bullish channel. Notably, the upper limit of the medium-term bearish channel is in the same area. So, any move up from there could be important for getting close to the 1,915 barrier. Even higher, the ascent may stop between the 2,000 round number.
On the other hand, if the price closes below $1,810, it may stay stable around the uptrend line ahead of the 1,805 support. Moving lower, the market may reach the 1,785 level, causing a sharper drop towards 1,752-1,762.
Overall, gold is still neutral in the short term, and traders are waiting for a long-term move above 1,890 or below 1,805 to give the market a new direction.
Author

Christina joined the XM investment research department in May 2017. She holds a master degree in Economics and Business from the Erasmus University Rotterdam with a specialization in International economics.


