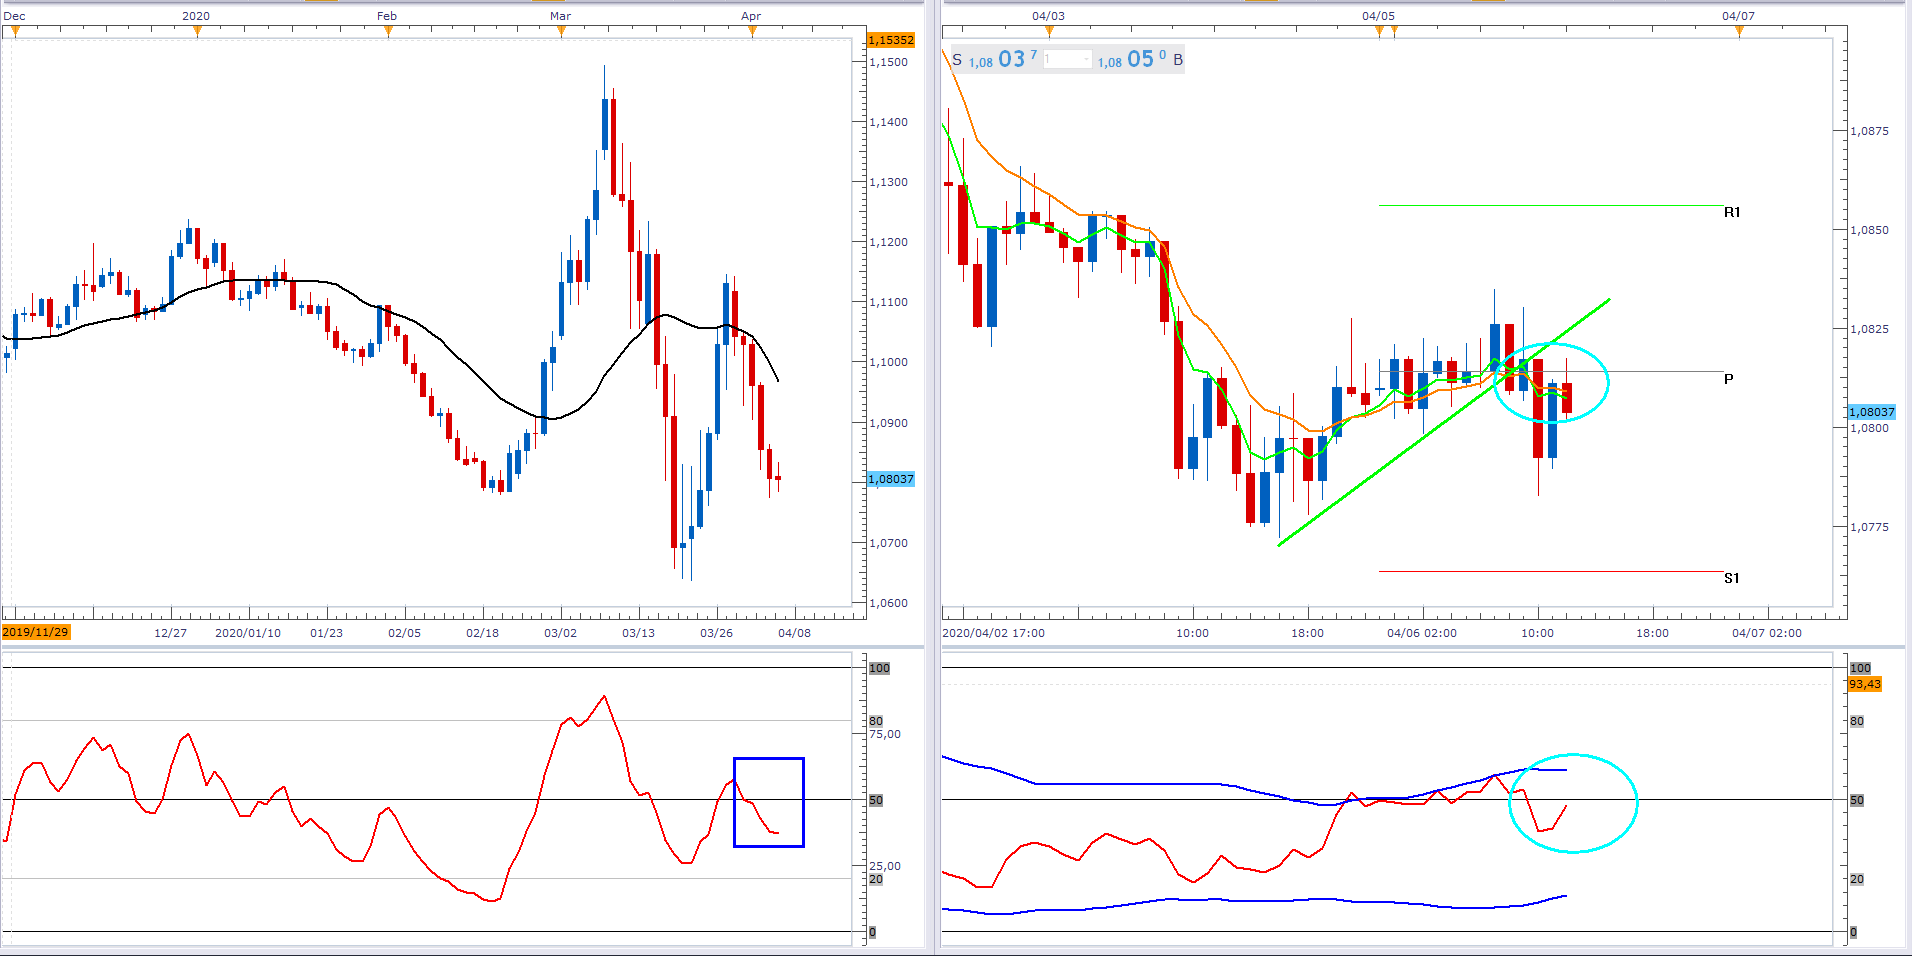
EUR/USD reacts off of central pivot on h1 chart

The below left chart shows the EURUSD daily time frame. Price is below the black 20-day SMA and the SMA is pointing down. In addition, the RSI is on the bearish side of 50 (blue rectangle). The right chart shows the hourly time frame. Here, the central pivot has acted as resistance and price has broken below the up-sloping green trend line. Moreover, the EMAs have turned bearish and the RSI is below 50. If the EMAs develop further angle and separation it will be viewed as a bearish development.
Past performance is not an indicator of future results
CHART SOURCE: FXCM MARKETSCOPE 2.0
Author

Russell Shor (MSTA, CFTe, MFTA) has an Honours Degree in Economics from the University of South Africa and holds the coveted Certified Financial Technician and Master of Financial Technical Analysis qualifications from the Interna


