EURNZD - Second triangle in a row

One of the heroes from the last week was the EURNZD. In our piece publish on the 5.11 wew were very bearish about this pair and we warned about the possible decline. That was a great call and we should write a small update about that too. This is what we wrote in our previous piece:
“Combination of those two factors, gave us a strong decline, which allowed the price to break the long-term up trendline (blue). That is a very negative sign and opens us a way towards the 1.655 so the lows from January and June. “
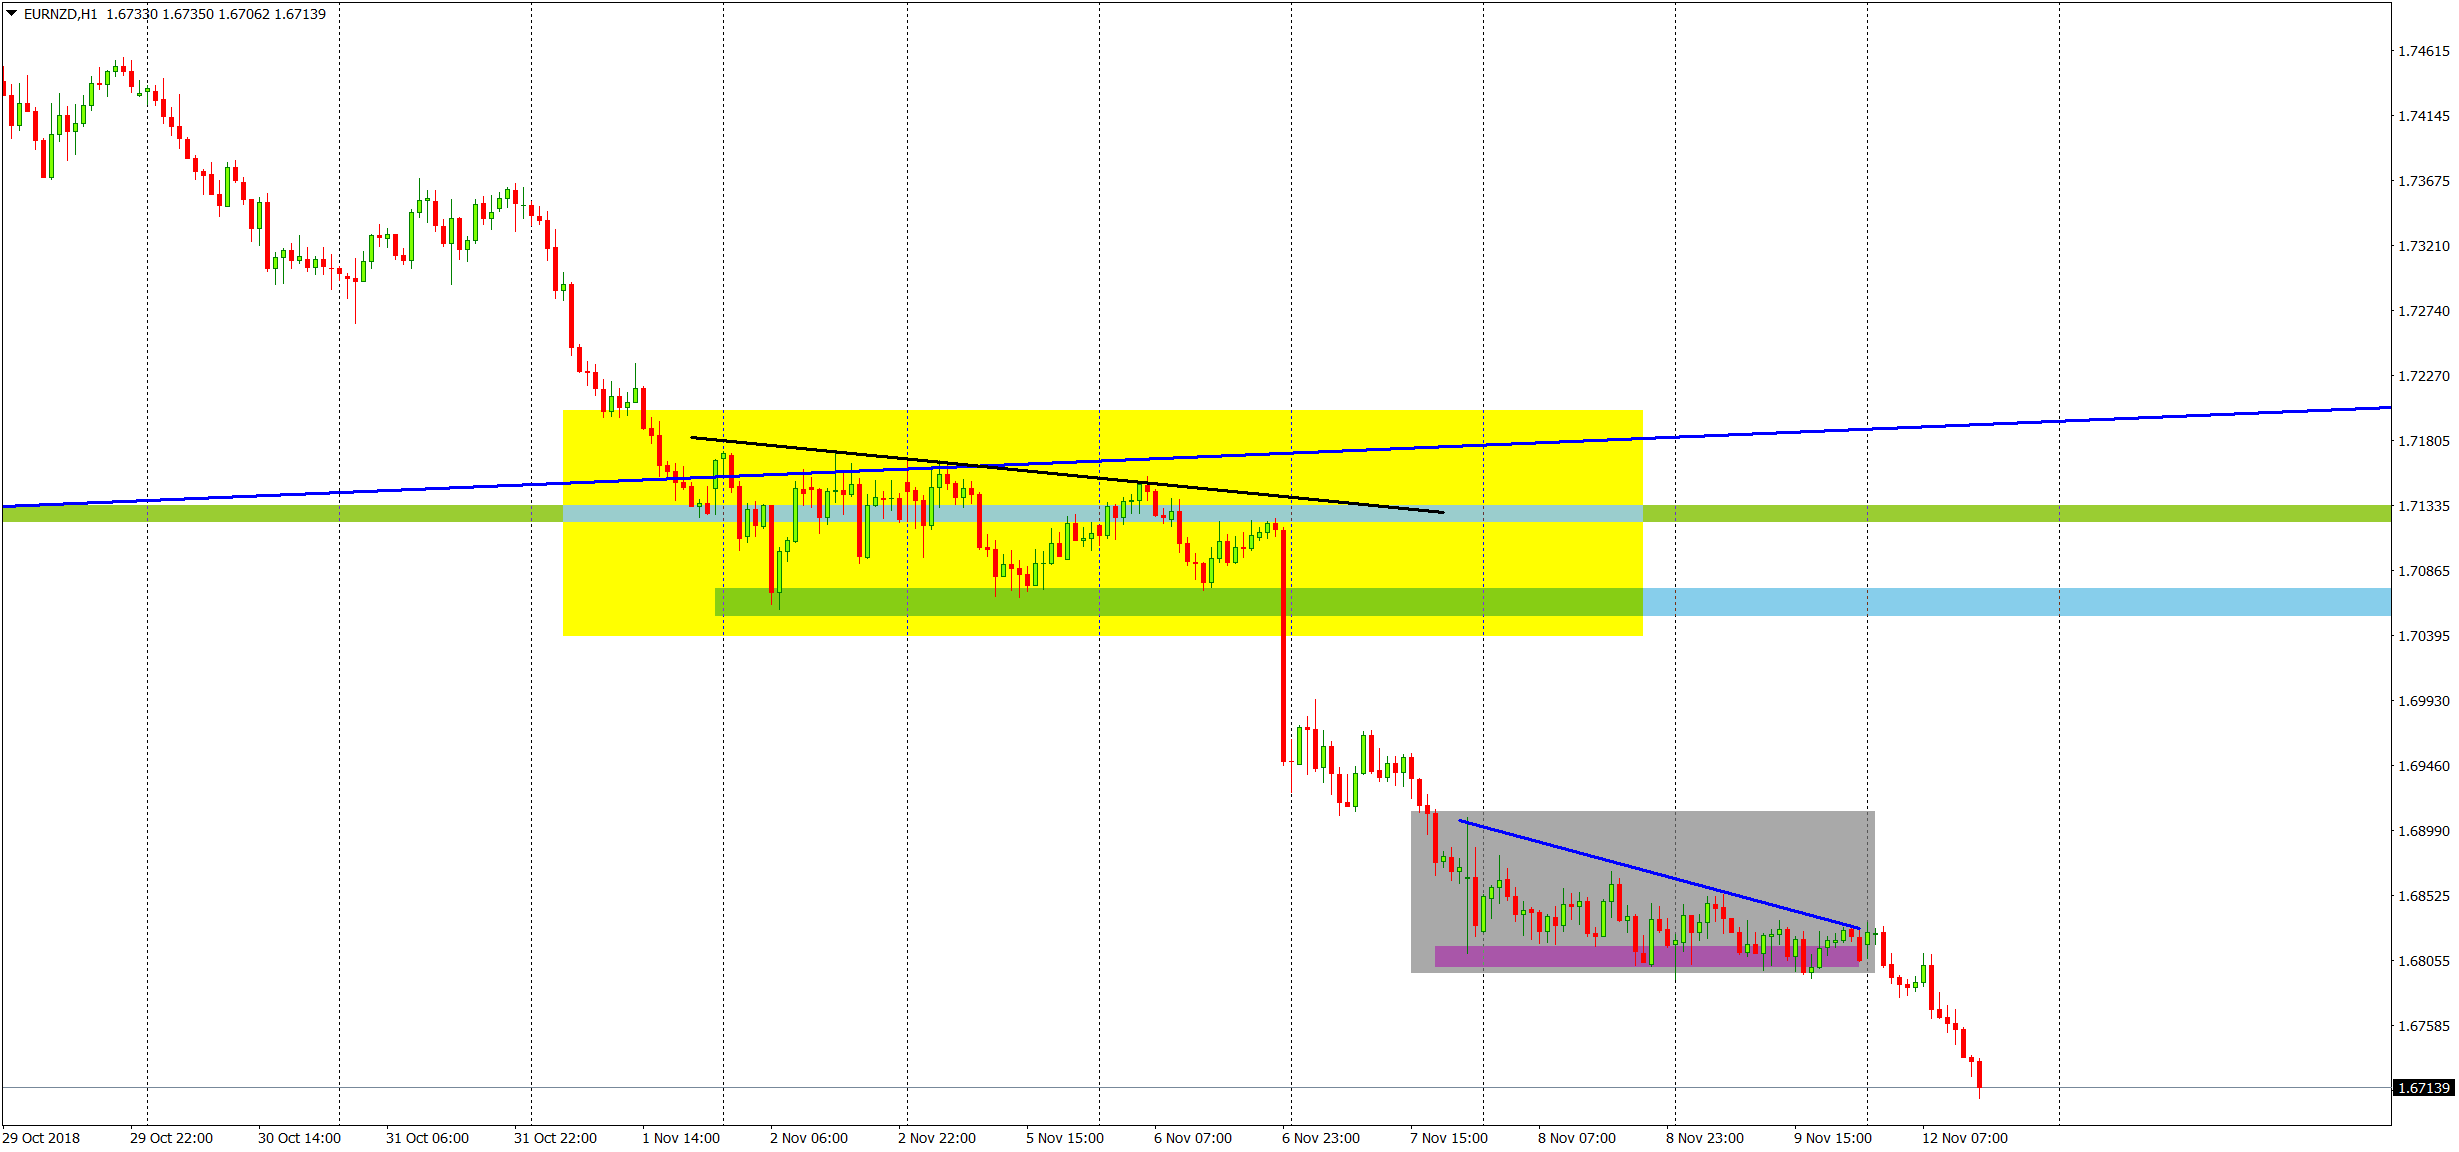
We did not have to wait long for a further slide. The price crated a descending triangle pattern (yellow) and broke it's lower line, which gave us a strong sell signal. On Thursday and Friday, the price stopped for a bit to have another correction – also shaped like a descending triangle (grey)! As you can see, history likes to repeat itself and the price broke the lower line of this formation too. With all this, the future slide seems inevitable. The long-term target for this is the 1.655, so the lows from January and June.
Author

Tomasz Wisniewski
Axiory Global Ltd.
Tomasz was born in Warsaw, Poland on 25th October, 1985.


