EUR/USD, USD/JPY, GBP/USD, WTI cash, US 500

EUR/USD daily chart
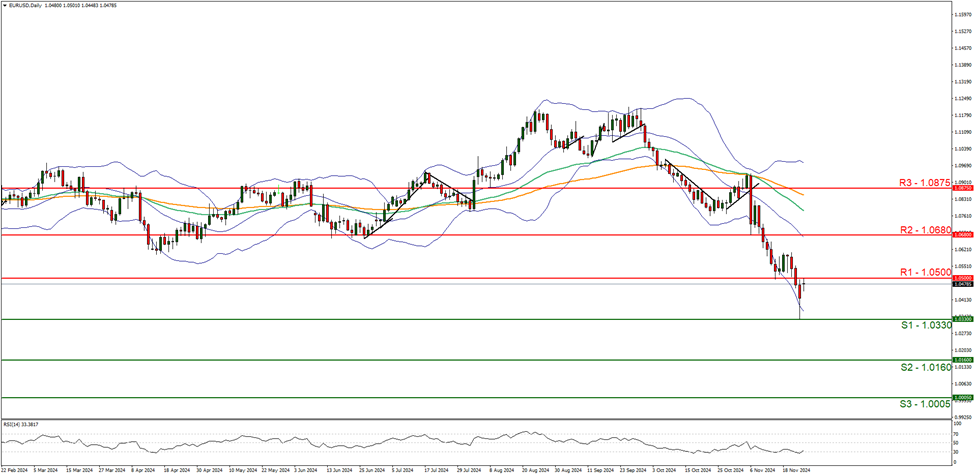
Support: 1.0330 (S1), 1.0160 (S2), 1.0005 (S3).
Resistance: 1.0500 (R1), 1.0680 (R2), 1.0875 (R3).
EUR/USD appears to be moving in a downwards trajectory, with the pair currently taking aim for our 1.0330 (S1) support level. Following the EUR’s downwards trajectory last week we would not be surprised to see the bears take a breather, yet we opt to maintain an overall bearish outlook and supporting our case is the RSI indicator below our chart which currently registers a figure near 30, implying a strong bearish market sentiment. For our bearish outlook to continue we would require a clear break below the 1.0330 (S1) support level with the next possible target for the bears being the 1.0160 (S2) support line. On the flip side for a bullish outlook we would require a clear break above the 1.0500 (R1) resistance line, if not also the 1.0680 (R2) resistance level with the next possible target for the bulls being the 1.0875 (R3) resistance line. Lastly for a sideways bias we would require the pair to remain confined between the 1.0330 (S1) support line and the 1.0500 (R1) resistance level.
USD/JPY daily chart
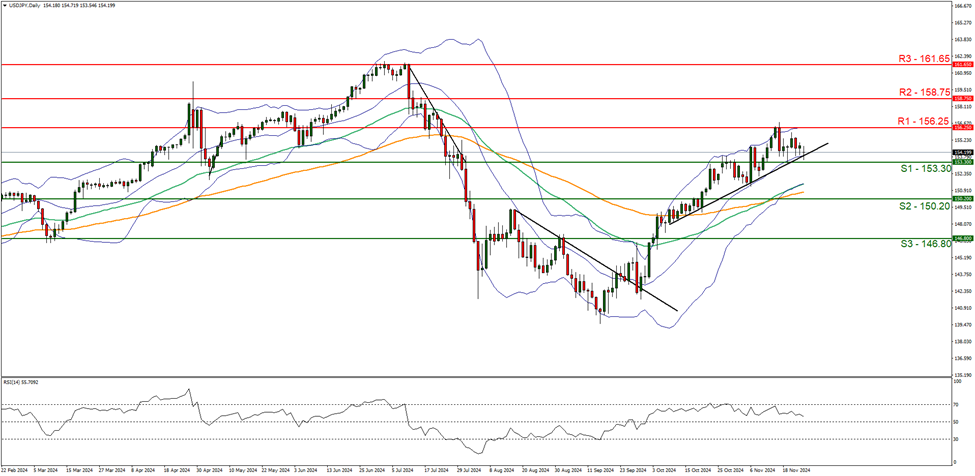
Support: 153.30 (S1), 150.20 (S2), 146.80 (S3).
Resistance: 156.25 (R1), 158.75 (R2), 161.65 (R3).
The pair appears to be moving in a sideways fashion. We opt for a sideways bias for the pair and supporting our case is the RSI indicator below our chart which currently registers a figure near 50, implying a neutral market sentiment. Yet should the pair fail to break below our upwards-moving trendline which was incepted on the 9th of October, one could argue that the bulls may be simply taking a breather. Nonetheless, for our sideways bias to continue, we would require the pair to remain confined between the 153.30 (S1) support line and the 156.25 (R1) resistance level. On the flip side for a bullish outlook, we would require a clear break above the 156.25 (R1) resistance line with the next possible target for the bulls being the 158.75 (R2) resistance level. Lastly, for a bearish outlook we would require a clear break below the 153.30 (S1) support line with the next possible target for the bears being the 150.20 (S2) support level.
GBP/USD daily chart
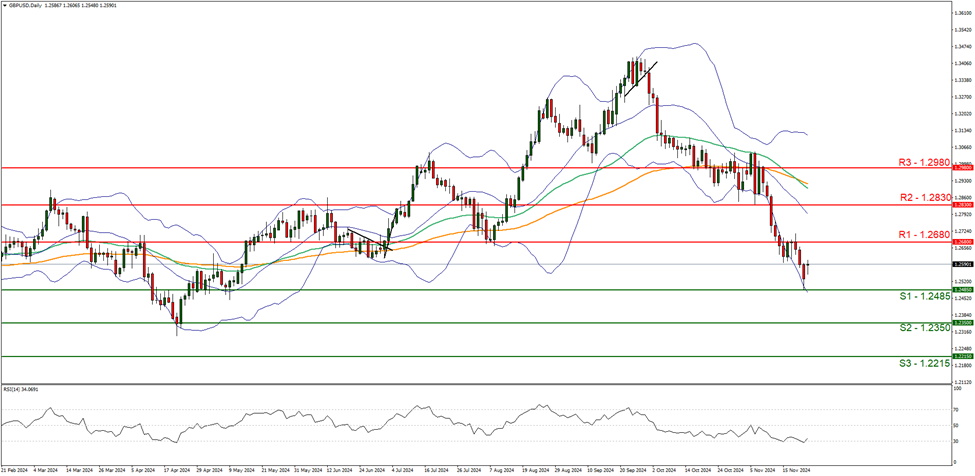
Support: 1.2485 (S1), 1.2350 (S2), 1.2215 (S3).
Resistance: 1.2680 (R1), 1.2830 (R2), 1.2980 (R3).
GBP/USD appears to be moving in a downwards fashion, despite having bounced off our 1.2485 (S1) support level. We opt for a bearish outlook for the pair and supporting our case is the RSI indicator below our chart which currently registers a figure near 30, implying a strong bearish market sentiment. Yet, the story is similar to that of the EUR and thus we would be surprised to see the bears take a breather, with the bulls potentially aiming to test the 1.2680 (R1) resistance line, before ceding control to the bears once again. Nonetheless, for our bearish outlook to continue, we would require a clear break below the 1.2485 (S1) support level, with the next possible target for the bears being the 1.2350 (S2) support line. On the flip side for a bullish outlook, we would require a clear break above the 1.2680 (R1) resistance line with the next possible target for the bulls being the 1.2830 (R2) resistance level. Lastly, for a sideways bias we would require the commodity to remain confined between the 1.2485 (S1) support level and the 1.2680 (R1) resistance line.
WTI cash daily chart
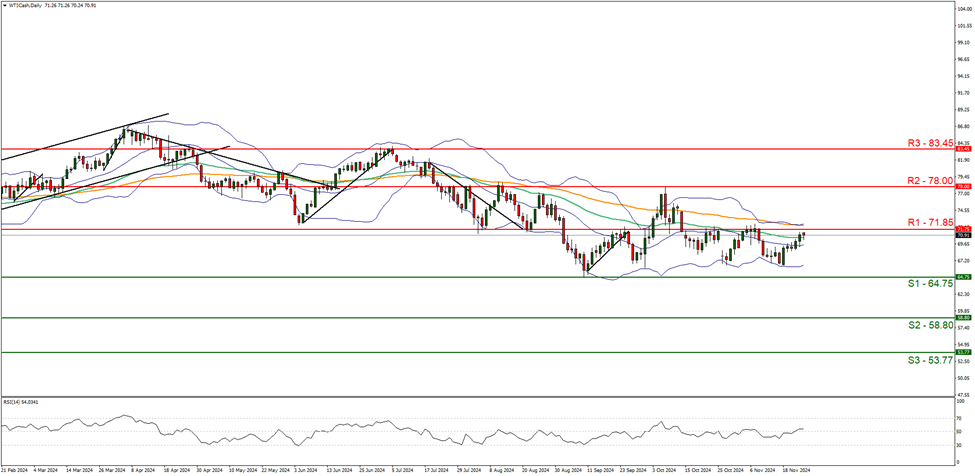
Support: 64.75 (S1), 57.30 (S2), 49.30 (S3).
Resistance: 71.85 (R1), 78.00 (R2), 83.45 (R3).
On the commodities front, oil prices appear to be moving in a sideways fashion after failing once again to break above the 71.85 (R1) resistance line. We opt for a sideways bias for the commodity’s price and supporting our case is the narrowing of the Bollinger bands which tend to imply low market volatility in addition to the failure to break above our aforementioned resistance level. Moreover, the RSI indicator below our chart currently registering a figure of 50 which tends to imply a neutral market sentiment. For our sideways bias to continue, we would require the commodity to remain confined between the sideways moving channel defined by the 64.75 (S1) support level and the 71.85 (R1) resistance line. On the flip side, for a bearish outlook we would require a clear break below the 64.75 (S1) support level, with the next possible target for the bears being 57.30 (S2) support base. Lastly, for a bullish outlook to occur, we would require a clear break above the 71.85 (R1) resistance line, with the next possible target for the bulls being the 78.00 (R2) resistance level.
US500 daily chart
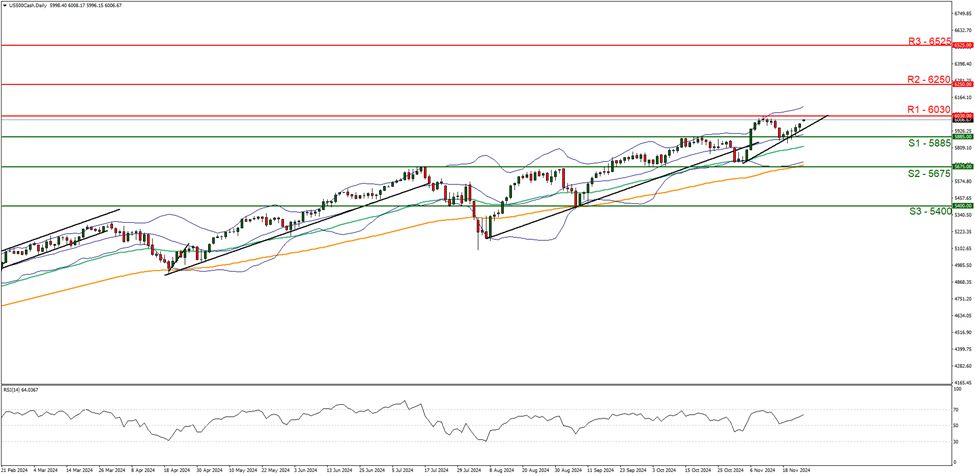
Support: 5885 (S1), 5675 (S2), 5400 (S3).
Resistance: 6030 (R1), 6250 (R2), 6525 (R3).
The S&P 500 appears to be on track to form another new all-time high, after failing to break below our 5885 (S1) support level. We opt for a bullish outlook for the index and supporting our case is the RSI indicator below our chart which currently registers a figure above 60 implying a bullish market sentiment, in addition to the upwards moving trendline which was incepted on the 4th of November. For our bullish outlook to continue, we would require a break above the 6030 (R1) potential resistance level, with the next possible target for the bulls being the 6250 (R2) resistance line. On the flip side for a sideways bias, we would require the index to remain between the 5885 (S1) support level and the 6030 (R1) resistance level. Lastly, for a bearish outlook, we would require a clear break below the 5885 (S1) support level with the next possible target for the bears being the 5675 (S2) support line.
Author

Phaedros Pantelides
IronFX
Mr Pantelides has graduated from the University of Reading with a degree in BSc Business Economics, where he discovered his passion for trading and analyzing global geopolitics.


