EUR/USD, USD/JPY, GBP/USD, USD/CAD

EUR/USD hour-four chart
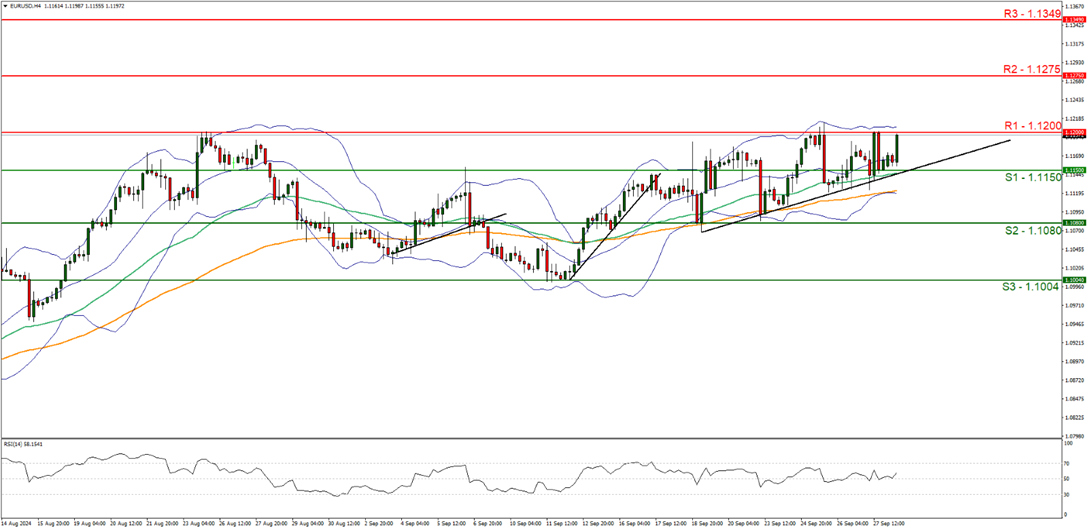
Support: 1.1150 (S1), 1.1080(S2), 1.1004 (S3).
Resistance: 1.1200(R1), 1.1275(R2), 1.1349(R3).
EUR/USD was on the rise today, with the pair currently taking aim for our 1.1200 (R1) resistance line, which was established as a resistance line on two occasions which were on the 25th and 27th of September. We opt for a bullish outlook for the pair and supporting our case is the upwards moving trendline which was incepted on the 19th of September, in addition to the RSI indicator below our chart which currently registers a figure near 60, implying a bullish market sentiment. Moreover, an ascending triangle appears to be forming in which the pair appears to be following an upwards trend but has met resistance at the “top” which we consider to be our 1.1200 (R1) resistance line. For our bullish outlook to continue, we would require a clear break above the 1.1200 (R1) resistance line with the next possible target for the bulls being the 1.1275 (R2) resistance level. On the flip side, for a sideways bias we would require the pair to remain confined between the 1.1150 (S1) support line and the 1.1200 (R1) resistance level. Lastly, for a bearish outlook we would require a clear break below the 1.1150 (S1) support line with the next possible target for the bears being the 1.1080 (S2) support level.
USD/JPY daily chart
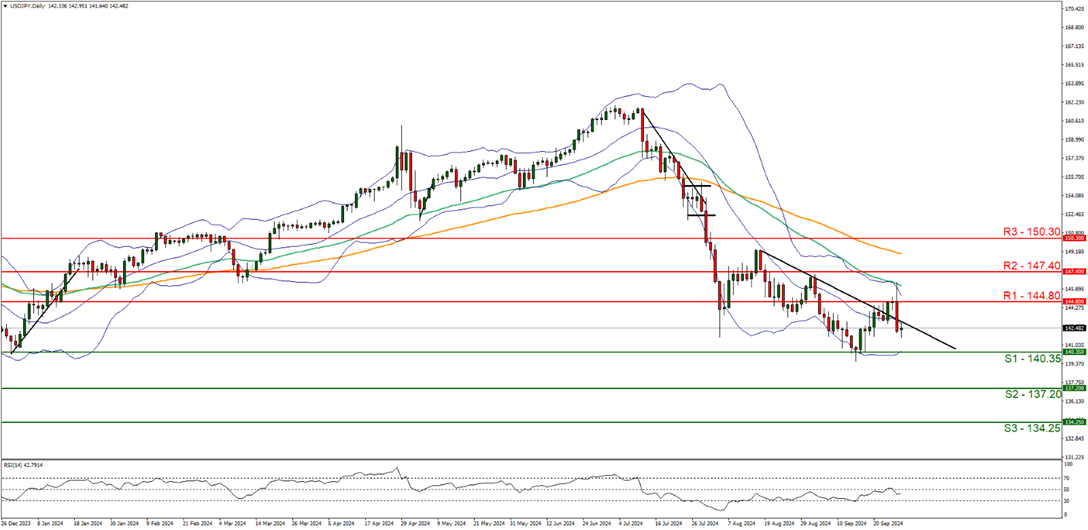
Support: 140.35 (S1), 137.20 (S2), 134.25 (S3).
Resistance: 144.80 (R1), 147.40 (R2), 150.30 (R3).
USD/JPY dropped on Friday, after failing to close above the 144.80 (R1) resistance line, with the pair now potentially taking aim for the 140.35 (S1) support level. We opt for a sideways bias for the pair and supporting our case is the pairs recent price action, in which it broke above our downwards moving trendline which was incepted 16th of August, yet failed to close above the 144.80 (R1) resistance line which may imply an undecided market sentiment. Yet, we should note that the RSI indicator below our chart does currently registers a figure near 40, implying a bearish market sentiment. Nonetheless, for our sideways bias to continue we would require the pair to remain confined between sideways moving channel defined by the 140.35 (S1) support level and the 144.80 (R1) resistance line. On the flip side, for a bearish outlook we would require a clear break below the 140.35 (S1) support line with the next possible target for the bears being the 137.20 (S2) support line. Lastly, for a bullish outlook we would require a clear break above the 144.80 (R1) resistance line, with the next possible target for the bulls being the 147.40 (R2) resistance level.
GBP/USD hour-four chart
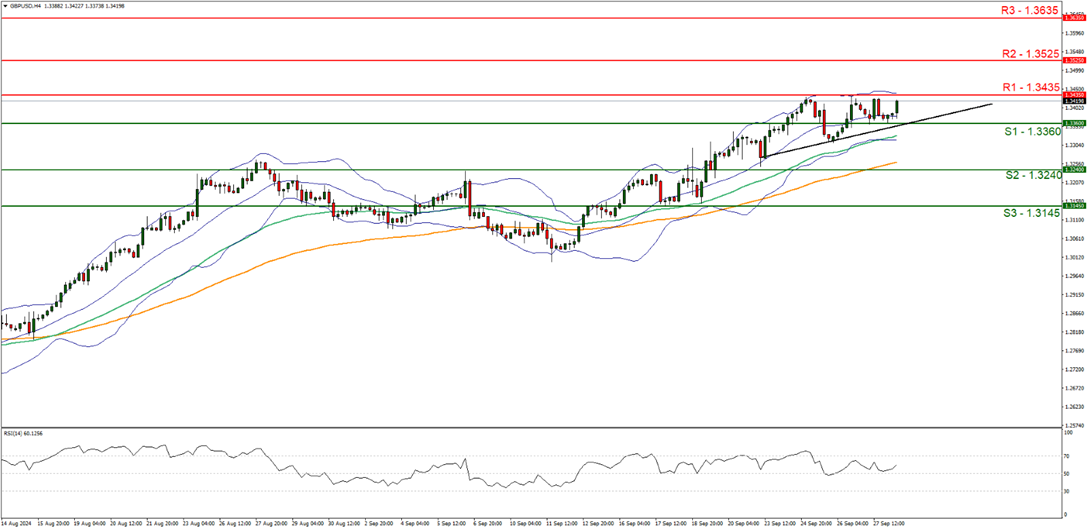
Support: 1.3360 (S1), 1.3240 (S2), 1.3145 (S3).
Resistance: 1.3435 (R1), 1.3525 (R2), 1.3635 (R3).
GBP/USD appears to be currently taking aim for our 1.3435 (R1) resistance level, after failing to break through on the past three occasions since the 24th of September. We opt for a bullish outlook for the pair and supporting our case is the RSI indicator below our chart which currently registers a figure near 60, implying a bullish market sentiment, in addition to the upwards moving trendline which was incepted on the 23rd of September. Yet, the Bollinger bands appear to be smoothening out, which may imply low market volatility. Nonetheless, for our bullish outlook to continue, we would require a clear break above the 1.3435 (R1) resistance level, with the next possible target for the bulls being the 1.3525 (R2) resistance line. On the flip side, for a sideways bias we would require the pair to remain confined between the 1.3360 (S1) support level and the 1.3435 (R1) resistance line. Lastly, for a bearish outlook we would require a clear break below the 1.3360 (S1) support line with the next possible target for the bears being the 1.3240 (S2) support level.
USD/CAD hour-four chart
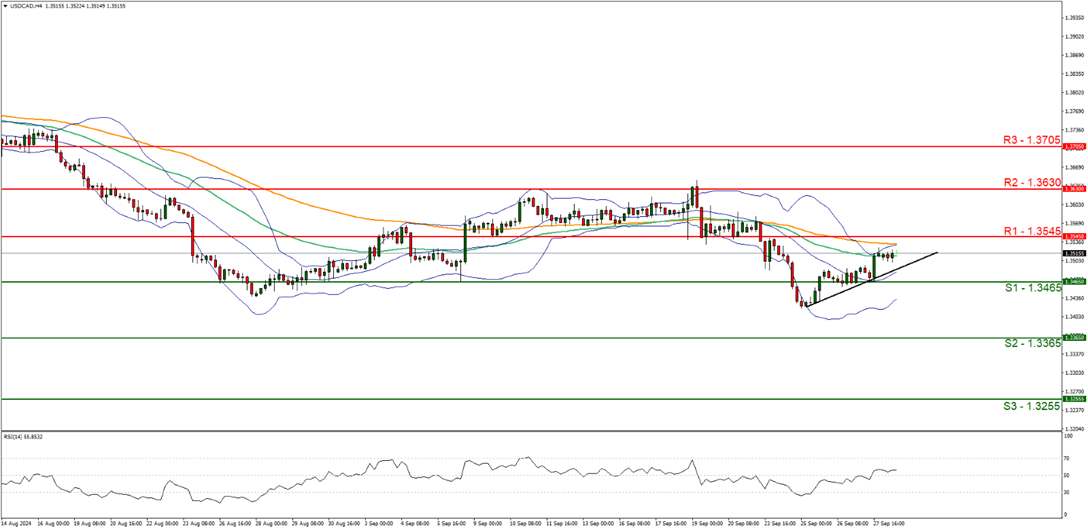
Support: 1.3465 (S1), 1.3365(S2), 1.3255(S3).
Resistance: 1.3545(R1), 1.3630 (R2), 1.3705(R3).
USD/CAD appears to be moving in an upwards fashion with the pair currently appearing to be taking aiming for the 1.3545 (R1) resistance line after retesting support at the 1.3465 (S1) level. We opt for a bullish outlook for the pair and supporting our case is the upwards moving trendline which was incepted on the 25th of September. Yet, the RSI indicator bellow our cart currently registers a figure just above 50, which may imply a neutral market sentiment. Nonetheless, for our bullish outlook to continue, we would require a clear break above the 1.3545 (R1) resistance line with the next possible target for the bulls being the 1.3630 (R2) resistance level. On the flip side for a sideways bias we would require the pair to remain confined between the sideways moving channel defined by the 1.3465 (S1) support line and the 1.3545 (R1) resistance level. Lastly, for a bearish outlook we would require a clear break below the 1.3465 (S1) support line with the next possible target for the bears being the 1.3365 (S2) support level.
Author

Phaedros Pantelides
IronFX
Mr Pantelides has graduated from the University of Reading with a degree in BSc Business Economics, where he discovered his passion for trading and analyzing global geopolitics.


