EUR/USD: technical analysis of the moment and recommendations

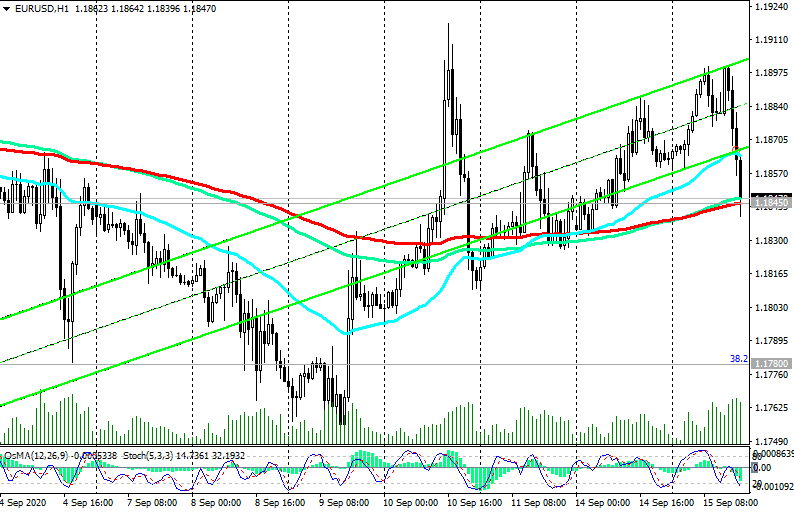
At the beginning of the American session on Tuesday, the EUR/USD pair declines, reaching the first important support level 1.1845 (ЕМА200 on the 1-hour chart). Since the pair, since May of this year, has maintained a long-term positive trend, remaining within the upward channel on the daily chart (the lower border of the channel passes through the 1.1780 mark (Fibonacci level 38.2% of the upward correction in the wave of the pair's decline from 1.3870, which began in May 2014), and the upper one is near the level of 1.2180, through which the resistance level in the form of the 50% Fibonacci level passes), then it would be logical to place a buy order from this support level, i.e. "by-the-market" at the moment.
In case of further decline, another pending buy order will be appropriate near the support level of 1.1780 (ЕМА200 on the 4-hour chart).
There is a high probability of a rebound from the support levels 1.1845, 1.1784 and a return of the EUR / USD pair to an uptrend. In this case, and after the breakdown of the resistance levels 1.1960 (ЕМА144 on the monthly chart), 1.2010 (local September highs and highs of the year), 1.2075 (ЕМА200 on the monthly chart), the level of 1.2180 will become the next growth target for EUR/USD.
In the alternative scenario, EUR/USD will break through the support level of 1.1780 and head towards the support level 1.1705 (ЕМА50 on the daily chart).
Further decline in EUR/USD in the current situation is unlikely - the dollar is under pressure from strong fundamental factors.
Perhaps the only strong argument and chance for the dollar to return to an uptrend is the change in the direction of the FRS monetary policy, which is extremely unlikely in the current situation.
The dollar remains vulnerable amid the Fed's aggressively stimulating monetary policy, the progress of the coronavirus pandemic in the country, and political unrest and uncertainty ahead of the presidential election in November.
Only a return to the zone below the support levels of 1.1340 (ЕМА200 on the daily chart), 1.1285 (Fibonacci level 23.6%) will mark the resumption of the bearish trend.
Support levels: 1.1845, 1.1780, 1.1705, 1.1490, 1.1400, 1.1340, 1.1285
Resistance levels: 1.1900, 1.1960, 1.2010, 1.2075, 1.2180, 1.2340, 1.2580
Trading recommendations
Sell Stop 1.1685. Stop-Loss 1.1720. Take-Profit 1.1600, 1.1490, 1.1400, 1.1340, 1.1285
Buy by market. Buy Limit 1.1780, 1.1710. Stop-Loss 1.1685. Take-Profit 1.1900, 1.1960, 1.2010, 1.2075, 1.2180, 1.2340, 1.2580

Author

Yuri Papshev
Independent Analyst
Independent trader and analyst at Forex market. Trade experience - more than 10 years. In trade Yuri Papshev uses a combination of fundamental and technical analysis.