|

EUR/USD starts new bullish cycle [Video]

Short term Elliott Wave view in EURUSD shows a bullish sequence from 6.1.2023 low. Rally from there is in progress as a 5 waves impulsive structure. Up from 6.1.2023 low, wave 1 ended at 1.1012 and dips in wave 2 ended at 1.0833. Internal subdivision of wave 2 unfolded as a double three Elliott Wave structure. Down from wave 1, wave ((w)) ended at 1.0843 and rally in wave ((x)) ended at 1.0976. Wave ((y)) lower ended at 1.0832 which also completed wave 2. Pair has since turned higher in wave 3.

EUR/USD 60 minutes Elliott Wave chart 

EURUSD

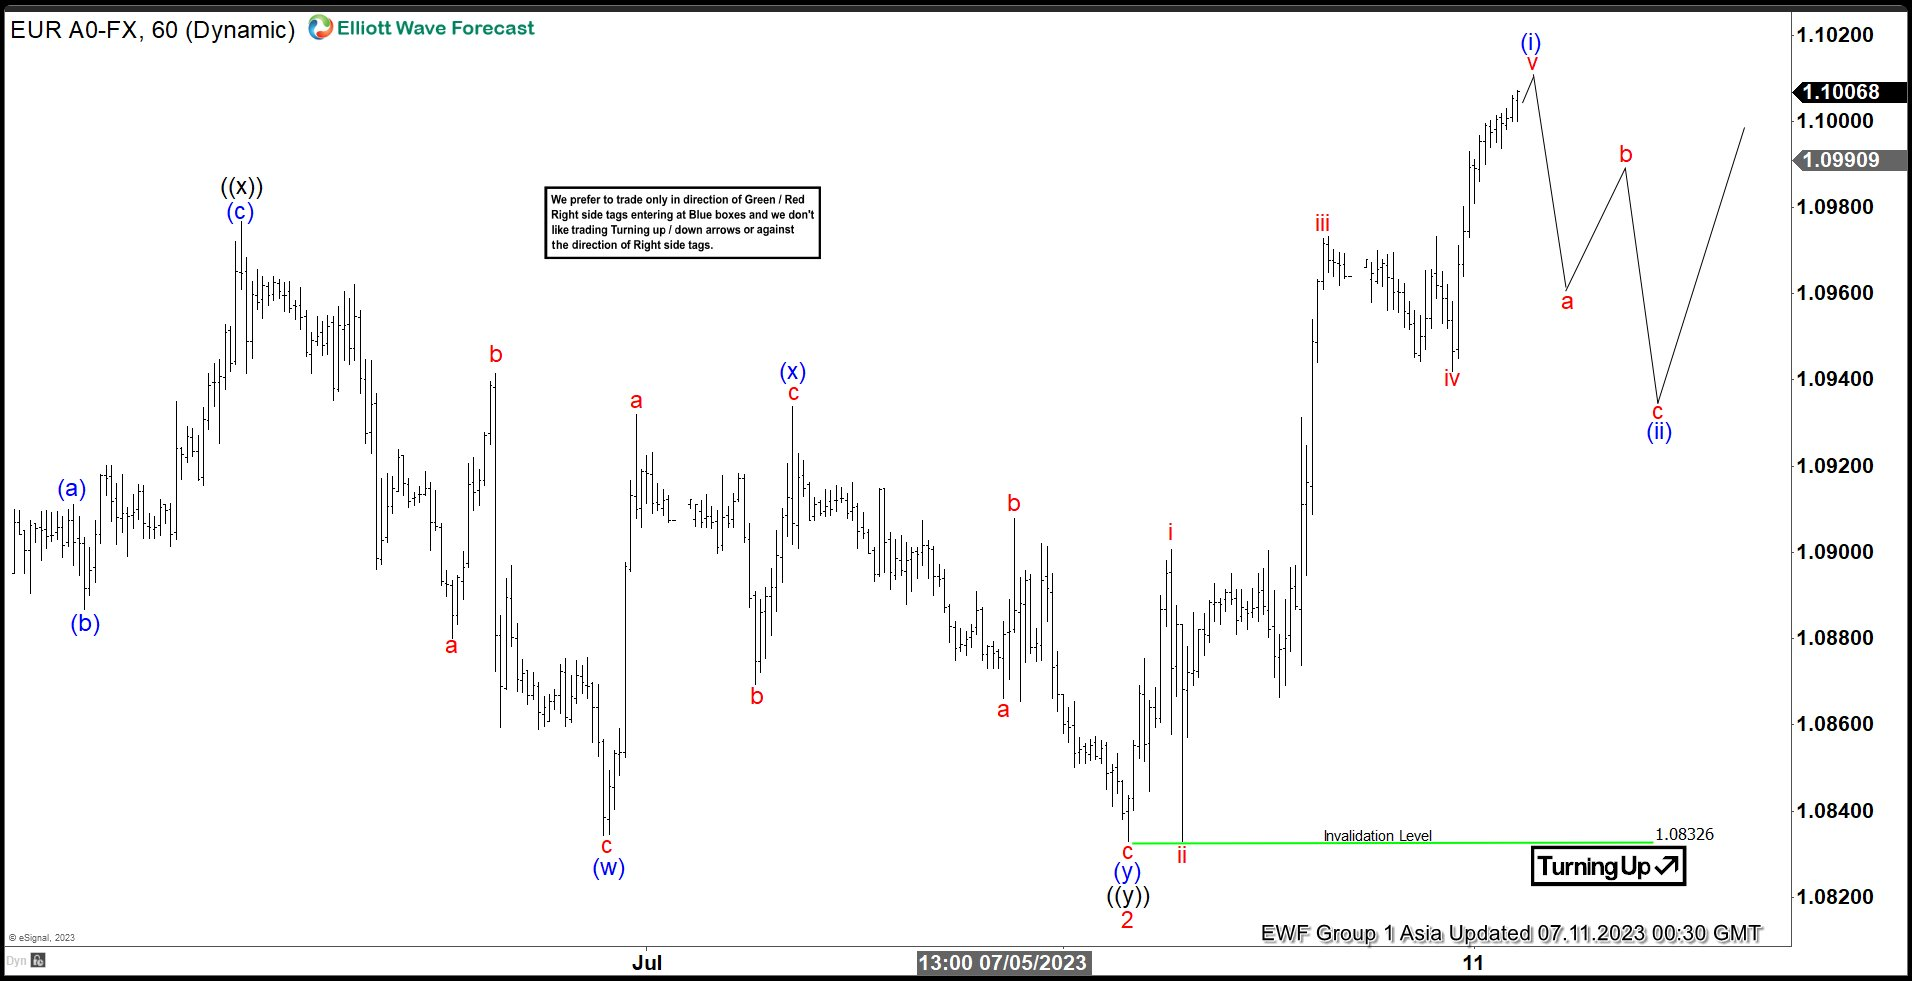
Up from wave 2, wave i ended at 1.09 and pullback in wave ii ended at 1.0833. Pair resumes higher in wave iii towards 1.0973 and dips in wave iv ended at 1.094. Pair resumes higher again in wave v and expected to complete wave (i) soon. Once wave (i) is complete, pair should pullback in wave (ii) to correct cycle from 7.6.2023 low in 3, 7, or 11 swing before the rally resumes again. As far as pivot at 1.083 low stays intact, expect dips to find support in 3, 7, or 11 swing for further upside.

EUR/USD Elliott Wave video

Author

Elliott Wave Forecast Team

Elliott Wave Forecast Team

ElliottWave-Forecast.com

More from Elliott Wave Forecast Team
Share:

Editor's Picks

EUR/USD trims gains, hovers around 1.1900 post-US data

EUR/USD trades slightly on the back foot around the 1.1900 region in a context dominated by the resurgence of some buying interest around the US Dollar on turnaround Tuesday. Looking at the US docket, Retail Sales disappointed expectations in December, while the ADP 4-Week Average came in at 6.5K.

GBP/USD comes under pressure near 1.3680

The better tone in the Greenback hurts the risk-linked complex on Tuesday, prompting GBP/USD to set aside two consecutive days of gains and trade slightly on the defensive below the 1.3700 mark. Investors, in the meantime, keep their attention on key UK data due later in the week.

Gold loses some traction, still above $5,000

Gold faces some selling pressure on Tuesday, surrendering part of its recent two-day advance although managing to keep the trade above the $5,000 mark per troy ounce. The daily pullback in the precious metal comes in response to the modest rebound in the US Dollar, while declining US Treasury yields across the curve seem to limit the downside.

XRP holds $1.40 amid ETF inflows and stable derivatives market

Ripple trades under pressure, with immediate support at $1.40 holding at the time of writing on Tuesday. A recovery attempt from last week’s sell-off to $1.12 stalled at $1.54 on Friday, leading to limited price action between the current support and the resistance.

Dollar drops and stocks rally: The week of reckoning for US economic data

Following a sizeable move lower in US technology Stocks last week, we have witnessed a meaningful recovery unfold. The USD Index is in a concerning position; the monthly price continues to hold the south channel support.

XRP holds $1.40 amid ETF inflows and stable derivatives market

Ripple trades under pressure, with immediate support at $1.40 holding at the time of writing on Tuesday. A recovery attempt from last week’s sell-off to $1.12 stalled at $1.54 on Friday, leading to limited price action between the current support and the resistance.