|

EUR/USD recovery runs into resistance, can it continue higher?

Key highlights

  • EUR/USD started a recovery wave above the 1.0710 resistance.
  • It cleared a major bearish trend line with resistance at 1.0725 on the 4-hour chart.

EUR/USD technical analysis

Looking at the 4-hour chart, the pair cleared a major bearish trend line with resistance at 1.0725. There was a move above the 38.2% Fib retracement level of the downward move from the 1.0852 swing high to the 1.0666 low.

However, the pair is now facing resistance near the 1.0760 zone and the 100 simple moving average (red, 4-hour). The 50% Fib retracement level of the downward move from the 1.0852 swing high to the 1.0666 low is also acting as a resistance.

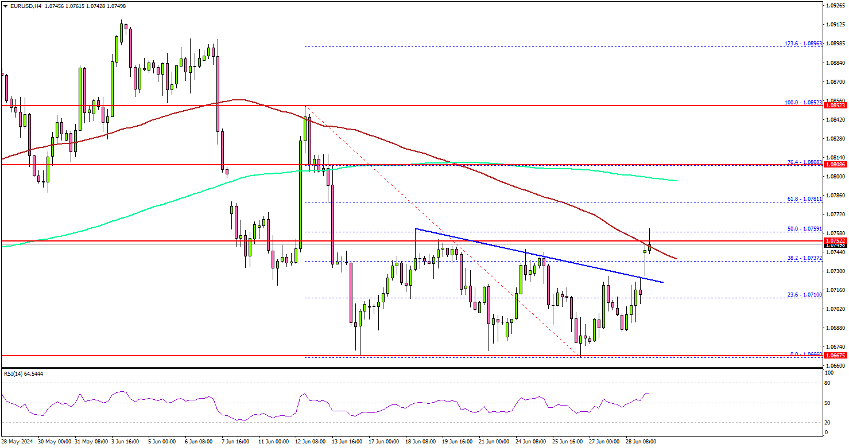
The next resistance sits at 1.0800 and the 200 simple moving average (green, 4-hour). A clear move above the 1.0800 resistance might send it toward the 1.0850 level.

Any more gains might open the doors for a test of the 1.0920 zone in the coming days. Immediate support is near the 1.0730 level. The next major support is near the 1.0700 level. A downside break and close below the 1.0700 support zone could open the doors for a larger decline. In the stated case, the pair could decline toward the 1.0665 level.

Author

Aayush Jindal

I have spent over six years as a financial markets contributor and observer, and possess strong technical analytical skills. I am a software engineer by profession, loves blogging and observing financial markets.

More from Aayush Jindal
Share:

Editor's Picks

EUR/USD extends its optimism past 1.1900

EUR/USD retains a firm underlying bid, surpassing the 1.1900 mark as the NA session draws to a close on Monday. The pair’s persistent uptrend comes as the US Dollar remains on the defensive, with traders staying cautious ahead of upcoming US NFP prints and CPI data.
 

GBP/USD tilts bullish as markets barrel toward mid-week NFP print

GBP/USD is holding a broader bullish structure on the daily chart, with price trading well above the 50 Exponential Moving Average at 1.3507 and the 200 EMA at 1.3310, confirming the intermediate uptrend that has been in place since the November 2025 low near 1.2300. 

Gold pushes back above $5,000

The daily chart shows spot Gold in a parabolic uptrend that accelerated sharply from the $4,600 area in late January, printing a record high at $5,598.25 before a violent reversal erased nearly $1,000 in value during the final days of the month. 

Litecoin eyes $50 as heavy losses weigh on investors

Following a strong downtrend across the crypto market over the past week, Litecoin holders are under immense pressure. The Bitcoin fork has trimmed about $1.81 billion from its market capitalization since the beginning of the year, sending it below the top 20 cryptos by market cap.

Japanese PM Takaichi nabs unprecedented victory – US data eyed this week

I do not think I would be exaggerating to say that Japanese Prime Minister Sanae Takaichi’s snap general election gamble paid off over the weekend – and then some. This secured the Liberal Democratic Party (LDP) an unprecedented mandate just three months into her tenure.

Ripple exposed to volatility amid low retail interest, modest fund inflows

Ripple (XRP) is extending its intraday decline to around $1.40 at the time of writing on Monday amid growing pressure from the retail market and risk-off sentiment that continues to keep investors on the sidelines.