EUR/USD kicked off the week with a drop below 1.1300, eventually hitting the lowest levels in two months. Can it recover from here or is the triple bottom in danger? The downside looks more appealing.

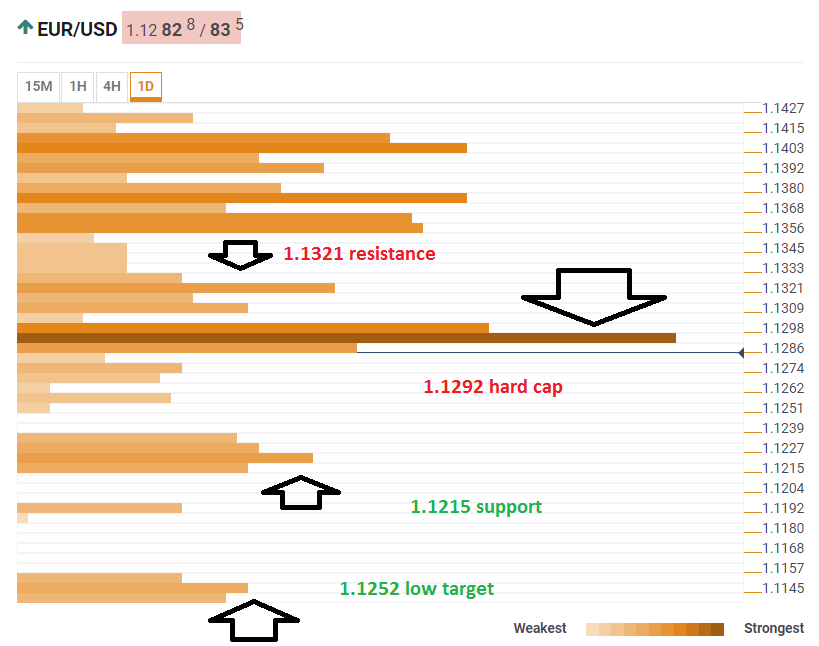
The Technical Confluences Indicator shows that euro/dollar faces a significant cap around 1.1292 where we see a dense cluster including the Bollinger Band one-day Lower, last month's low, the Simple Moving Average 100-15m, the Fibonacci 38.2% one-day, and the Pivot Point on one-month Support 1. 

Significant support awaits only at around 1.1215 which was the 2018 low and also converges with the Pivot Point one-week Support 2 and the PP one-day S2.

If EUR/USD extends its fall, the low target is 1.1152 where we see the meeting point of the PP one-month S3 and the PP one-month S2.

On the topside, immediate resistance is at 1.1321 which is the confluence of the PP one-day R1, last week's low, and the BB 4h-Middle.

Here is how it looks on the tool:

EUR USD technical confluence February 12 2019

Confluence Detector

The Confluence Detector finds exciting opportunities using Technical Confluences. The TC is a tool to locate and point out those price levels where there is a congestion of indicators, moving averages, Fibonacci levels, Pivot Points, etc. Knowing where these congestion points are located is very useful for the trader, and can be used as a basis for different strategies.

This tool assigns a certain amount of “weight” to each indicator, and this “weight” can influence adjacents price levels. These weightings mean that one price level without any indicator or moving average but under the influence of two “strongly weighted” levels accumulate more resistance than their neighbors. In these cases, the tool signals resistance in apparently empty areas.

Learn more about Technical Confluence

Information on these pages contains forward-looking statements that involve risks and uncertainties. Markets and instruments profiled on this page are for informational purposes only and should not in any way come across as a recommendation to buy or sell in these assets. You should do your own thorough research before making any investment decisions. FXStreet does not in any way guarantee that this information is free from mistakes, errors, or material misstatements. It also does not guarantee that this information is of a timely nature. Investing in Open Markets involves a great deal of risk, including the loss of all or a portion of your investment, as well as emotional distress. All risks, losses and costs associated with investing, including total loss of principal, are your responsibility. The views and opinions expressed in this article are those of the authors and do not necessarily reflect the official policy or position of FXStreet nor its advertisers. The author will not be held responsible for information that is found at the end of links posted on this page.

If not otherwise explicitly mentioned in the body of the article, at the time of writing, the author has no position in any stock mentioned in this article and no business relationship with any company mentioned. The author has not received compensation for writing this article, other than from FXStreet.

FXStreet and the author do not provide personalized recommendations. The author makes no representations as to the accuracy, completeness, or suitability of this information. FXStreet and the author will not be liable for any errors, omissions or any losses, injuries or damages arising from this information and its display or use. Errors and omissions excepted.

The author and FXStreet are not registered investment advisors and nothing in this article is intended to be investment advice.

Recommended Content


Recommended Content

Editors’ Picks

EUR/USD inches higher to near 1.0900; next barrier at four-month highs

EUR/USD inches higher to near 1.0900; next barrier at four-month highs

EUR/USD advances for the second consecutive day, trading around 1.0900 during early Tuesday's European session. The analysis of the daily chart shows a weakening of a bullish trend, as the pair is positioned below an ascending channel.

EUR/USD News

GBP/USD bullish potential seems intact while above 1.2900 mark

GBP/USD bullish potential seems intact while above 1.2900 mark

GBP/USD lacks firm intraday direction and oscillates in a narrow range on Tuesday. The fundamental backdrop and the technical setup seem tilted in favor of bulls. A convincing break below the 1.2900 mark is needed to negative the positive bias.

GBP/USD News

Gold's struggle with $2,400 extends amid market caution

Gold's struggle with $2,400 extends amid market caution

Gold price is making another attempt to reclaim $2,400 on a sustained basis, replicating the moves seen during Monday’s Asian trading. Gold price appears to be benefiting from a typical market caution and renewed China’s economic worries and ahead of key US earnings reports.

Gold News

Top 3 Price Prediction Bitcoin, Ethereum, Ripple: Bitcoin finds support around the $67,000 level

Top 3 Price Prediction Bitcoin, Ethereum, Ripple: Bitcoin finds support around the $67,000 level

Bitcoin and Ripple prices are holding steady around their respective weekly and daily support levels, hinting at an imminent rally. Meanwhile, Ethereum is encountering resistance at the $3,530 mark; a decisive close above this level would signal a bullish breakthrough.

Read more

Earnings review

Earnings review

In recent years, the focus has been on the Magnificent 7, particularly Nvidia’s monster earnings reports, which have dominated the market. While Nvidia’s results are still extremely important for overall sentiment, there is a hope that sales growth and revenues can pick up across a broad range of global markets and sectors.

Read more

Majors

Cryptocurrencies

Signatures