EUR/USD Current price: 1.1082
- The Eurozone Harmonized Index of Consumer Prices rose 1.8% in the year to September.
- Multiple Federal Reserve officials will hit the wires during American trading hours.
- EUR/USD is bearish in the near term, may extend its slide towards 1.1000.
The EUR/USD pair falls for a third consecutive day, trading below the 1.1100 ahead of Wall Street's opening. The US Dollar (USD) benefits from a sour market mood and comments from Federal Reserve (Fed) Chair Jerome Powell. Powell cooled down expectations for another 50 basis points (bps) interest rate cut on Monday, as he said the central bank is in no hurry to cut rates quickly.
In the meantime, the Eurozone published the preliminary estimate of the September Harmonized Index of Consumer Prices (HICP), which rose 1.8% in the twelve months to September, down from the 2.2% posted in August. On a monthly basis, the index was down 0.1%. Softer-than-anticipated inflation figures allow the European Central Bank (ECB) to proceed with additional monetary loosening, weighing on the Euro.
Across the Atlantic, the United States (US) has a busy session, as it will publish the Job Openings and Labor Turnover Survey (JOLTS) and the ISM Manufacturing Index for September. Additionally, multiple Fed officials will be on the wires.
EUR/USD short-term technical outlook
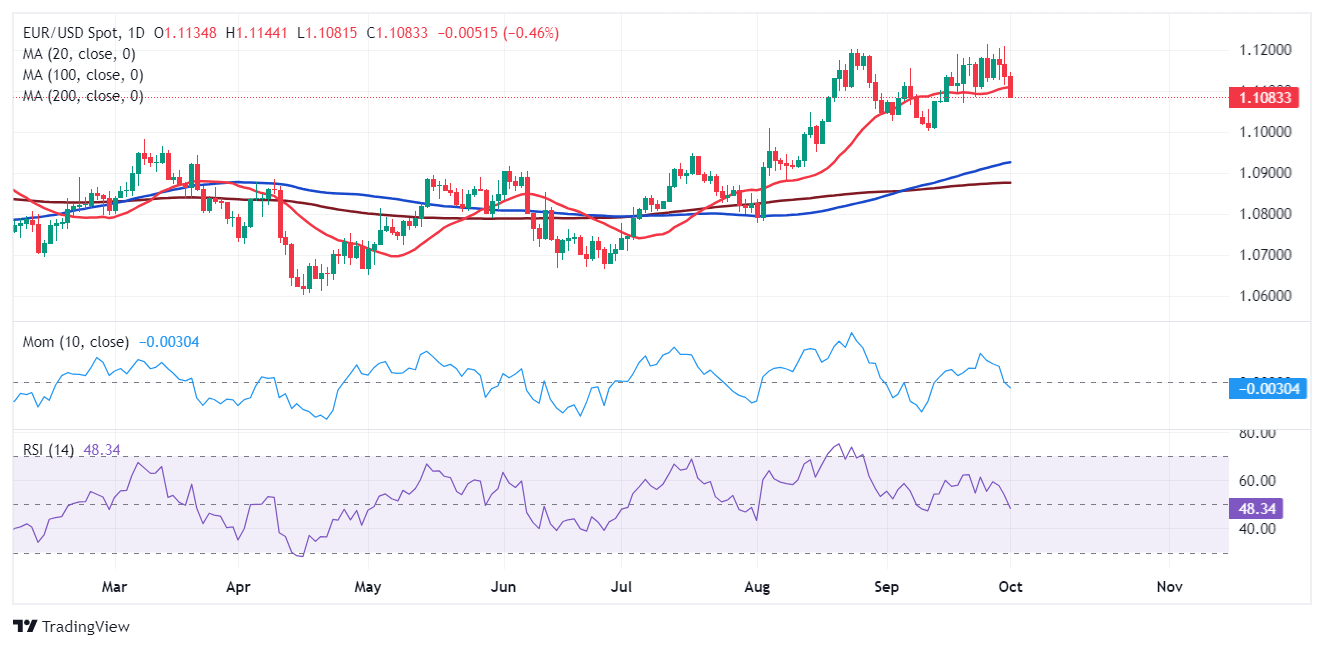
From a technical point of view, the EUR/USD pair seems poised to extend its slump. In the daily chart, the pair has broken below its 20 Simple Moving Average (SMA) now providing dynamic resistance at around 1.1105. At the same time, the pair holds above the 100 and 200 SMAs, which limits the bearish potential. Finally, technical indicators have turned south, reflecting persistent selling interest. The Relative Strength Index (RSI) indicator stands at around 48, already within negative levels and in line with lower lows ahead.
In the near term, and according to the 4-hour chart, the bearish case is even clearer. The EUR/USD pair is currently developing below all its moving averages, with intraday sellers now aligned around the 100 SMA in the 1.1110 price zone. Technical indicators, in the meantime, head firmly lower within negative levels, anticipating another leg south.
Support levels: 1.1075 1.1040 1.1000
Resistance levels: 1.1110 1.1150 1.1200
Information on these pages contains forward-looking statements that involve risks and uncertainties. Markets and instruments profiled on this page are for informational purposes only and should not in any way come across as a recommendation to buy or sell in these assets. You should do your own thorough research before making any investment decisions. FXStreet does not in any way guarantee that this information is free from mistakes, errors, or material misstatements. It also does not guarantee that this information is of a timely nature. Investing in Open Markets involves a great deal of risk, including the loss of all or a portion of your investment, as well as emotional distress. All risks, losses and costs associated with investing, including total loss of principal, are your responsibility. The views and opinions expressed in this article are those of the authors and do not necessarily reflect the official policy or position of FXStreet nor its advertisers. The author will not be held responsible for information that is found at the end of links posted on this page.
If not otherwise explicitly mentioned in the body of the article, at the time of writing, the author has no position in any stock mentioned in this article and no business relationship with any company mentioned. The author has not received compensation for writing this article, other than from FXStreet.
FXStreet and the author do not provide personalized recommendations. The author makes no representations as to the accuracy, completeness, or suitability of this information. FXStreet and the author will not be liable for any errors, omissions or any losses, injuries or damages arising from this information and its display or use. Errors and omissions excepted.
The author and FXStreet are not registered investment advisors and nothing in this article is intended to be investment advice.
Recommended Content
Editors’ Picks

Gold trades near record-high, stays within a touching distance of $3,100
Gold clings to daily gains and trades near the record-high it set above $3,080 earlier in the day. Although the data from the US showed that core PCE inflation rose at a stronger pace than expected in February, it failed to boost the USD.

EUR/USD turns positive above 1.0800
The loss of momentum in the US Dollar allows some recovery in the risk-associated universe on Friday, encouraging EUR/USD to regain the 1.0800 barrier and beyond, or daily tops.

GBP/USD picks up pace and retests 1.2960
GBP/USD now capitalises on the Greenback's knee-jerk and advances to the area of daily peaks in the 1.2960-1.2970 band, helped at the same time by auspicious results from UK Retail Sales.

Donald Trump’s tariff policies set to increase market uncertainty and risk-off sentiment
US President Donald Trump’s tariff policies are expected to escalate market uncertainty and risk-off sentiment, with the Kobeissi Letter’s post on X this week cautioning that while markets may view the April 2 tariffs as the "end of uncertainty," it anticipates increased volatility.

US: Trump's 'Liberation day' – What to expect?
Trump has so far enacted tariff changes that have lifted the trade-weighted average tariff rate on all US imports by around 5.5-6.0%-points. While re-rerouting of trade will decrease the effectiveness of tariffs over time, the current level is already close to the highest since the second world war.

The Best brokers to trade EUR/USD
SPONSORED Discover the top brokers for trading EUR/USD in 2025. Our list features brokers with competitive spreads, fast execution, and powerful platforms. Whether you're a beginner or an expert, find the right partner to navigate the dynamic Forex market.