The EUR/USD is stable in the wake of a new week, but its prospects have not improved. The Technical Confluences Indicator shows that stronger clusters of resistance remain to the upside while fewer confluence zones await on the downside.
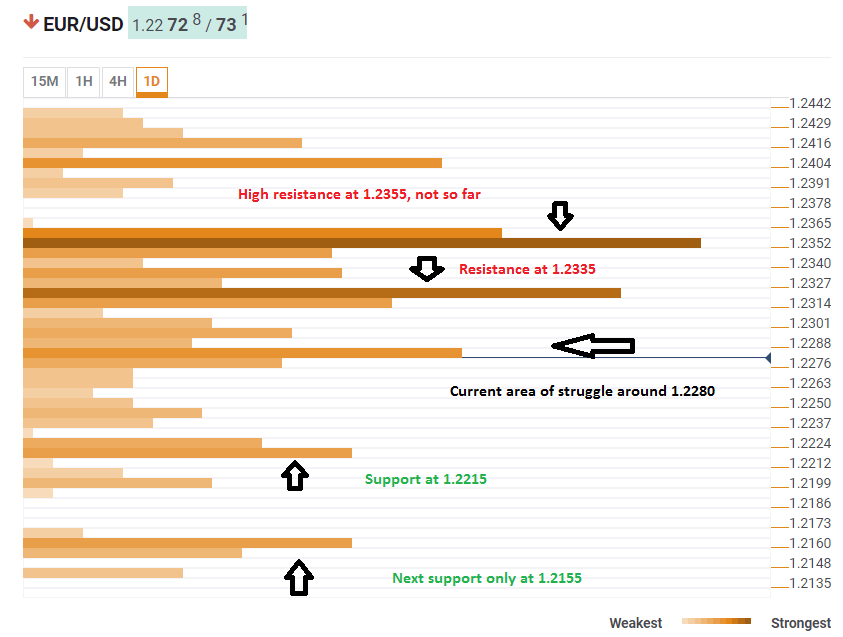
The pair is struggling around 1.2280, where we see congestion of the Simple Moving Average 5-15m, the SMA50-15m, the Fibonacci 61.8% one-month, the Bolinger Band 15m-Upper (Stdv. 2.2), the BB 1h-Middle, the SMA-5-1hv, the Fibo 23.6%, and the SMA10-1h.
If the pair indeed drops, support is found around 1.2215, the meeting point of the Pivot Point one-week S1 and the one-month low. Even lower, at 1.2155, we find the Pivot Point one-month S1 and the Pivot Point one-week S2.
If the pair moves back up, we find congestion of resistance lines around $1.2330: the SMA50-1h, the SMA200-15m, the SMA100-4h, the Fibo 38.2% one-week, and the Fibo 61.8% one-day.
Further above, a dense convergence is quite close, at around $1.2355, which is the meeting point of the SMA100-1h, the SMA50-4h, the SMA200-1h, the SMA5-1d, and the Fibo 61.8% one-week.
All in all, the lines to the upside are of higher importance and very close to each other, while the downside has more lightweight.
Here is how it looks on the tool:
Confluence Detector
The Confluence Detector finds exciting opportunities using Technical Confluences. The TC is a tool to locate and point out those price levels where there is a congestion of indicators, moving averages, Fibonacci levels, Pivot Points, etc. Knowing where these congestion points are located is very useful for the trader, and can be used as a basis for different strategies.
This tool assigns a certain amount of “weight” to each indicator, and this “weight” can influence adjacents price levels. This means that one price level without any indicator or moving average but under the influence of two “strongly weighted” levels accumulate more resistance than their neighbors. In these cases, the tool signals resistance in apparently empty areas.
Information on these pages contains forward-looking statements that involve risks and uncertainties. Markets and instruments profiled on this page are for informational purposes only and should not in any way come across as a recommendation to buy or sell in these assets. You should do your own thorough research before making any investment decisions. FXStreet does not in any way guarantee that this information is free from mistakes, errors, or material misstatements. It also does not guarantee that this information is of a timely nature. Investing in Open Markets involves a great deal of risk, including the loss of all or a portion of your investment, as well as emotional distress. All risks, losses and costs associated with investing, including total loss of principal, are your responsibility. The views and opinions expressed in this article are those of the authors and do not necessarily reflect the official policy or position of FXStreet nor its advertisers. The author will not be held responsible for information that is found at the end of links posted on this page.
If not otherwise explicitly mentioned in the body of the article, at the time of writing, the author has no position in any stock mentioned in this article and no business relationship with any company mentioned. The author has not received compensation for writing this article, other than from FXStreet.
FXStreet and the author do not provide personalized recommendations. The author makes no representations as to the accuracy, completeness, or suitability of this information. FXStreet and the author will not be liable for any errors, omissions or any losses, injuries or damages arising from this information and its display or use. Errors and omissions excepted.
The author and FXStreet are not registered investment advisors and nothing in this article is intended to be investment advice.
Recommended Content
Editors’ Picks
EUR/USD eases below 1.0900 amid cautious mood

EUR/USD has erased gains to trade on the back foot below 1.0900 early Tuesday. The pair treads water amid a cautious market mood, as traders weigh the US political updates and China slowdown worries. The US Dollar remains subdued, in the absence of top-tier economic data.
GBP/USD drops toward 1.2900 as US Dollar looks to stabilize

GBP/USD is dropping toward 1.2900, lacking firm direction in European trading on Tuesday. The US Dollar looks to stabilize after the early decline, weighing on the pair. Traders await mid-tier US housing data for fresh trading impetus.
Gold price struggles to gain ground amid mixed fundamental cues

A combination of factors drag the Gold price lower to nearly a one-week low on Tuesday. Bets that the Fed will cut rates in September could lend support and help limit losses.
Bitcoin price struggles around $67,000 as US Government transfers, Mt. Gox funds movement weigh

Bitcoin (BTC) struggles around the $67,000 mark and declines by 1.7% at the time of writing on Tuesday at around $66,350. Bitcoin spot ETFs saw significant inflows of $530.20 million on Monday.
Big tech rebound ahead of earnings, Oil slips
/stock-market-graph-gm532464153-55981218_XtraSmall.jpg)
Tesla and Google are due to report earnings today after the bell, and their results could shift the wind in either direction. Despite almost doubling its stock price between April and July, Tesla sees appetite for its cars and its market share under pressure.