|

EUR/USD hits crucial floor: Bounce back or breakdown ahead?

Key highlights

  • EUR/USD started a downside correction and traded below 1.1320.
  • A connecting bearish trend line is forming with resistance at 1.1330 on the 4-hour chart.

EUR/USD technical analysis

Looking at the 4-hour chart, the pair started a fresh decline below the 1.1380 and 1.1350 levels. There was a close below the 1.1320 level and the 100 simple moving average (red, 4-hour). Finally, the pair tested the 1.1200 support zone and the 200 simple moving average (green, 4-hour).

A low was formed at 1.1187 and the pair is now consolidating losses. On the upside, the pair could face resistance near the 1.1250 level. The next key resistance sits near the 1.1275 level and the 23.6% Fib retracement level of the downward move from the 1.1572 swing high to the 1.1187 low.

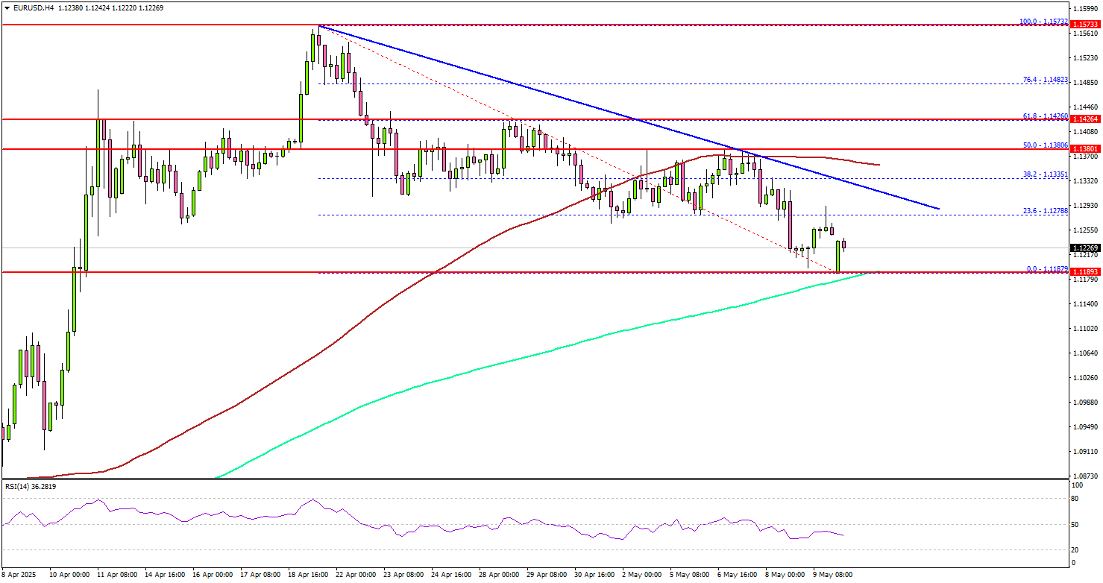
The first major resistance sits at 1.1320. There is also a connecting bearish trend line forming with resistance at 1.1330 on the same chart.

A close above the 1.1330 level could set the tone for another increase. In the stated case, the pair could even clear the 1.1380 resistance. The next major stop for the bulls could be near the 1.1425 level and the 61.8% Fib retracement level of the downward move from the 1.1572 swing high to the 1.1187 low.

On the downside, immediate support sits near the 1.1190 level and the 200 simple moving average (green, 4-hour). The next key support sits near the 1.1150 level. Any more losses could send the pair toward the 1.1020 level.

Author

Aayush Jindal

I have spent over six years as a financial markets contributor and observer, and possess strong technical analytical skills. I am a software engineer by profession, loves blogging and observing financial markets.

More from Aayush Jindal
Share:

Editor's Picks

EUR/USD consolidates around 1.0900, bullish bias remains ahead of key US data

The EUR/USD pair is seen consolidating its strong gains registered over the past two days and oscillating in a narrow band during the Asian session on Tuesday. Spot prices currently trade around the 1.1900 mark, just below an over one-week high touched the previous day.

GBP/USD tilts bullish as markets barrel toward mid-week NFP print

GBP/USD is holding a broader bullish structure on the daily chart, with price trading well above the 50 Exponential Moving Average at 1.3507 and the 200 EMA at 1.3310, confirming the intermediate uptrend that has been in place since the November 2025 low near 1.2300. 

Gold: Will US Retail Sales data propel it above $5,100?

Gold hovers below weekly highs of $5,087 early Tuesday, await US Retail Sales data. The US Dollar enters a downside consolidation phase amid persistent Japanese Yen strength and worsening labor market. Gold settled Monday above $5,000, now looks to take out $5,100 amid bullish daily RSI.

Top Crypto Gainers: World Liberty Financial, MemeCore and Quant gain momentum

World Liberty Financial, MemeCore, and Quant are leading gains over the last 24 hours as the broader cryptocurrency market stabilizes after last week’s correction. Still, the technical outlook for altcoins remains mixed due to prevailing downside pressure and vulnerable market sentiment. 

Follow the money, what USD/JPY in Tokyo is really telling you

Over the past two Tokyo sessions, this has not been a rate story. Not even close. Interest rate differentials have been spectators, not drivers. What has moved USD/JPY in local hours has been flow and flow alone.

Ripple exposed to volatility amid low retail interest, modest fund inflows

Ripple (XRP) is extending its intraday decline to around $1.40 at the time of writing on Monday amid growing pressure from the retail market and risk-off sentiment that continues to keep investors on the sidelines.