|

EUR/USD freefalls: Are there signs of a rebound?

Key highlights

  • EUR/USD started another decline and traded below the 1.0500 support.
  • A major bearish trend line is forming with resistance at 1.0485 on the 4-hour chart.

EUR/USD technical analysis

Looking at the 4-hour chart, the pair settled below the 1.0500 support, the 100 simple moving average (red, 4-hour), and the 200 simple moving average (green, 4-hour). It even tested the 1.0335 zone. A low was formed at 1.0333 and the pair is now consolidating losses.

On the upside, the pair could face resistance near the 1.0440 level. The first major resistance is near the 1.0485 level. There is also a bearish trend line forming with resistance at 1.0485 on the same chart.

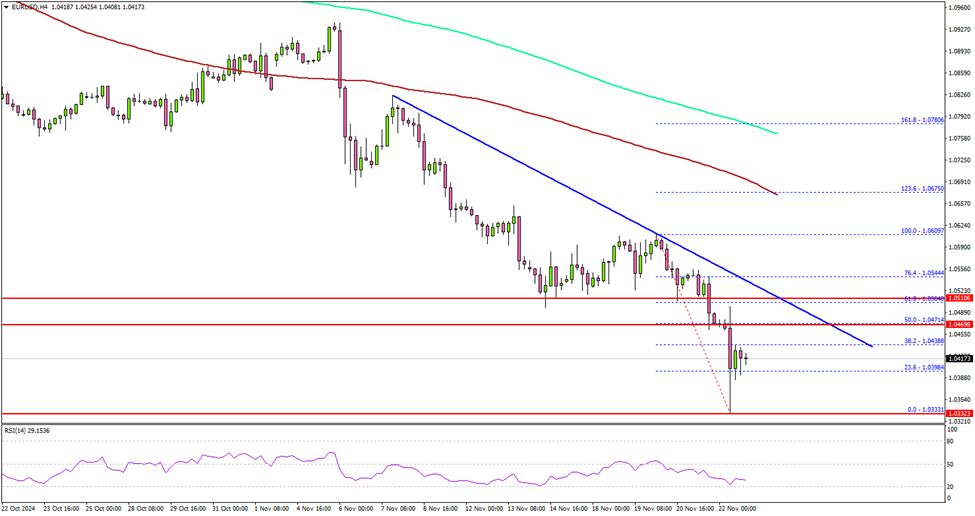
A close above the 1.0485 level could set the tone for another increase. The next major resistance could be 1.0520, above which the price could climb higher toward the 1.0550 resistance. Any more gains might send EUR/USD toward 1.0600.

On the downside, immediate support sits near the 1.0350 level. The next key support sits near the 1.0335 level. Any more losses could send the pair toward the 1.0300 level.

Author

Aayush Jindal

I have spent over six years as a financial markets contributor and observer, and possess strong technical analytical skills. I am a software engineer by profession, loves blogging and observing financial markets.

More from Aayush Jindal
Share:

Editor's Picks

EUR/USD holds above 1.1750 after mixed EU PMI data

EUR/USD manages to hold above 1.1750 but struggles to gather recovery momentum on Friday, following the mixed February PMI figures from Germany and the Eurozone. In the second half of the day, Q4 GDP, December inflation and February PMI data from the US will be watched closely by market participants.

GBP/USD recovers further toward 1.3500 after UK PMI data

GBP/USD is recovering ground further toward 1.3500 in European trading on Friday, helped by a modest uptick in the Pound Sterling after stronger-than-expected UK January Retail Sales and February PMI data. However, the pair's further upside could be limited amid persistent US Dollar strength as the focus turns to key US data. 

Gold sticks to positive bias above $5,000 ahead of US data

Gold gains some positive traction for the third consecutive day on Friday. holding above $5,000. Traders now look forward to the key US macro releases – the Advance Q4 GDP report and the Personal Consumption Expenditures (PCE) Price Index – for fresh trading impetus. 

US GDP growth expected to slow down significantly in Q4 after stellar Q3 

The United States Bureau of Economic Analysis will publish the first preliminary estimate of the fourth-quarter Gross Domestic Product at 13:30 GMT. Analysts forecast the US economy to have expanded at a 3% annualized rate, slowing down from the 4.4% growth posted in the previous quarter.

Iran tensions and AI fears at the forefront ahead of key US data

Thursday’s scorecard shows major US Stock benchmarks closed modestly in the red amid mounting US-Iran tensions and AI disruption worries. The S&P 500 shed 19 points (0.3%) to 6,861, the Nasdaq 100 lost 101 points (0.4%) to 24,797, and the Dow Jones Industrial Average dropped 267 points (0.5%) to 49,395.

Official Trump price approaches breakout with mixed signals from traders

Official Trump (TRUMP) is trading at $3.50 at the time of writing, approaching its upper consolidation range. A breakout from this range could open the door for an upside move. On-chain data shows market indecision, with balanced flows between bulls and bears, signaling a lack of clear directional bias.