EUR/USD Forecast: US data to set the tone for the day

EUR/USD Current Price: 1.0560
- The US will publish January Durable Goods Orders, expected to have fallen sharply.
- European stock markets shrugged off the sour tone of their Asian counterparts and advance.
- EUR/USD bounced modestly from a fresh monthly low, no signs of further gains ahead.
The EUR/USD pair slid to 1.0532 early on Monday as the US Dollar extended its last week’s momentum at the beginning of the new week. A Hotter-than-anticipated United States Personal Consumption Expenditures (PCE) Price Index released on Friday fueled demand for the American currency as financial markets anticipate monetary tightening will continue well into this year. Hopes that the US Federal Reserve (Fed) could pivot diluted with January data and the FOMC Meeting outcome from early February.
Asian stock markets stand in the red, although European ones hold on to modest intraday gains, leading to an advance in US futures. Raising equities are weighing on the USD demand in the near term, with EUR/USD currently trading at around 1.0560.
Unimpressive European data prevented the Euro from advancing further. The Economic Sentiment Indicator contracted to 99.7 in February from 99.8 in the previous month and missed the market expectation of 101. Additionally, M3 Money Supply was up 3.5% YoY in January, below the 3.9% anticipated by market participants. Attention is now on US Durable Goods Orders, expected to have declined by 4% in January, much worse than the previous 5.6% advance. The country will also publish January Pending Home Sales later in the American session.
EUR/USD short-term technical outlook
The daily chart for the EUR/USD pair shows that it consolidates last week’s losses. Technical indicators lack directional strength, but hold within negative levels, indicating absent buying interest. At the same time, the pair continues to develop below a bearish 20 Simple Moving Average (SMA), while the 100 SMA maintains a mildly bullish slope below the current level. At the same time, the pair approaches the 50% Fibonacci retracement of the 2022 slide at 1.0515, a strong static support level.
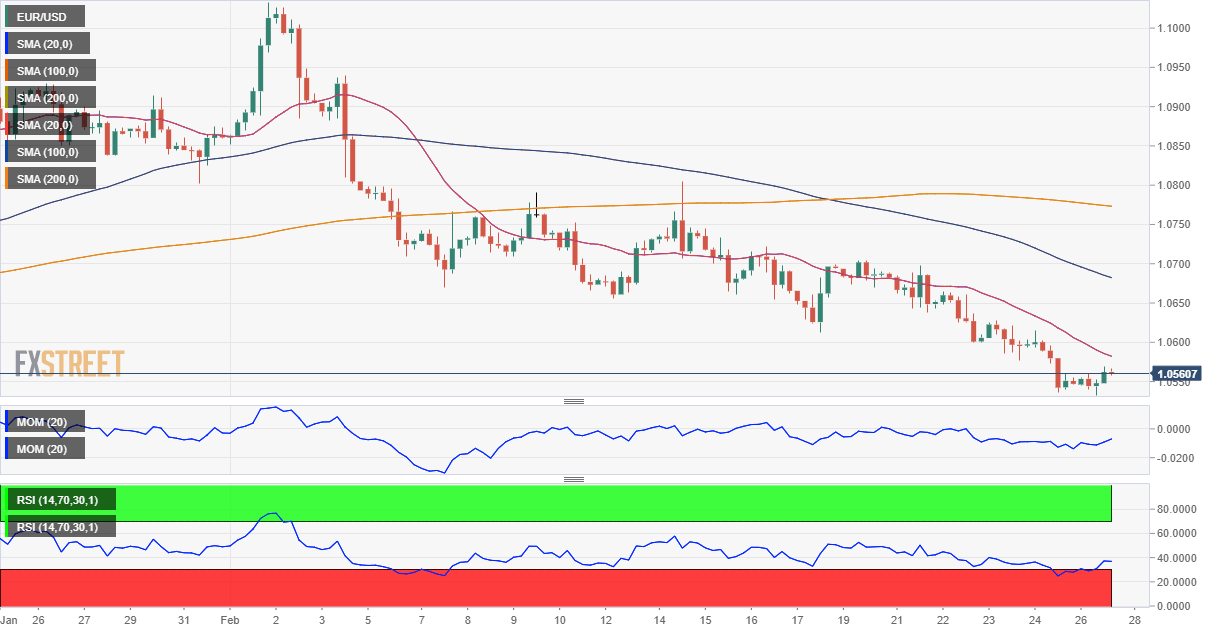
In the near term, and according to the 4-hour chart, the risk is skewed to the downside. The pair develops below all its moving averages, with the 20 SMA accelerating south below the longer ones and providing dynamic resistance at around 1.0590. The Momentum indicator remains flat below its 100 SMA while the Relative Strength Index (RSI) indicator bounced just modestly from oversold levels, not enough to support another leg higher.
Support levels: 1.0515 1.0470 1.0420
Resistance levels: 1.0590 1.0640 1.0695
Premium
You have reached your limit of 3 free articles for this month.
Start your subscription and get access to all our original articles.
Author

Valeria Bednarik
FXStreet
Valeria Bednarik was born and lives in Buenos Aires, Argentina. Her passion for math and numbers pushed her into studying economics in her younger years.


