EUR/USD Forecast: The next target emerges at the 200-day SMA
- EUR/USD rose to a new two-week high around 1.0740.
- Advanced US Q1 GDP came in short of estimates.
- Markets’ attention now shifts to the upcoming US PCE.
The renewed downside momentum of the US Dollar (USD) prompted a decent reaction in EUR/USD on Thursday, extending the recent recovery to the 1.0740 region, or two-week tops.
The Dollar's downswing followed the unexpected miss in the first estimate of the Q1 GDP Growth Rate despite quarterly inflation tracked by the GDP deflator rising above consensus, all kicking back a potential interest rate cut by the Federal Reserve (Fed) for later in the year.
The renewed weakness in the Greenback coincided with an increase to fresh multi-month tops in US yields across different time frames against the backdrop of a consistent narrative highlighting the divergence in monetary policies between the Fed and other G10 central banks, notably the European Central Bank (ECB).
Recent comments from ECB board members have hinted at the ECB initiating its easing cycle in June, with speculation swirling about three interest rate cuts (or 75 bps) for the rest of the year. Conversely, bets on the Fed’s rate cut in September seem to have lost momentum ahead of the release of key PCE prints on Friday.
Looking ahead, the relatively subdued economic fundamentals in the Eurozone, coupled with the resilience of the US economy, bolster expectations for a stronger Dollar in the medium term, particularly considering the likelihood of the ECB cutting rates before the Fed. In such a scenario, EUR/USD is anticipated to undergo a more significant decline in the short term.
EUR/USD daily chart
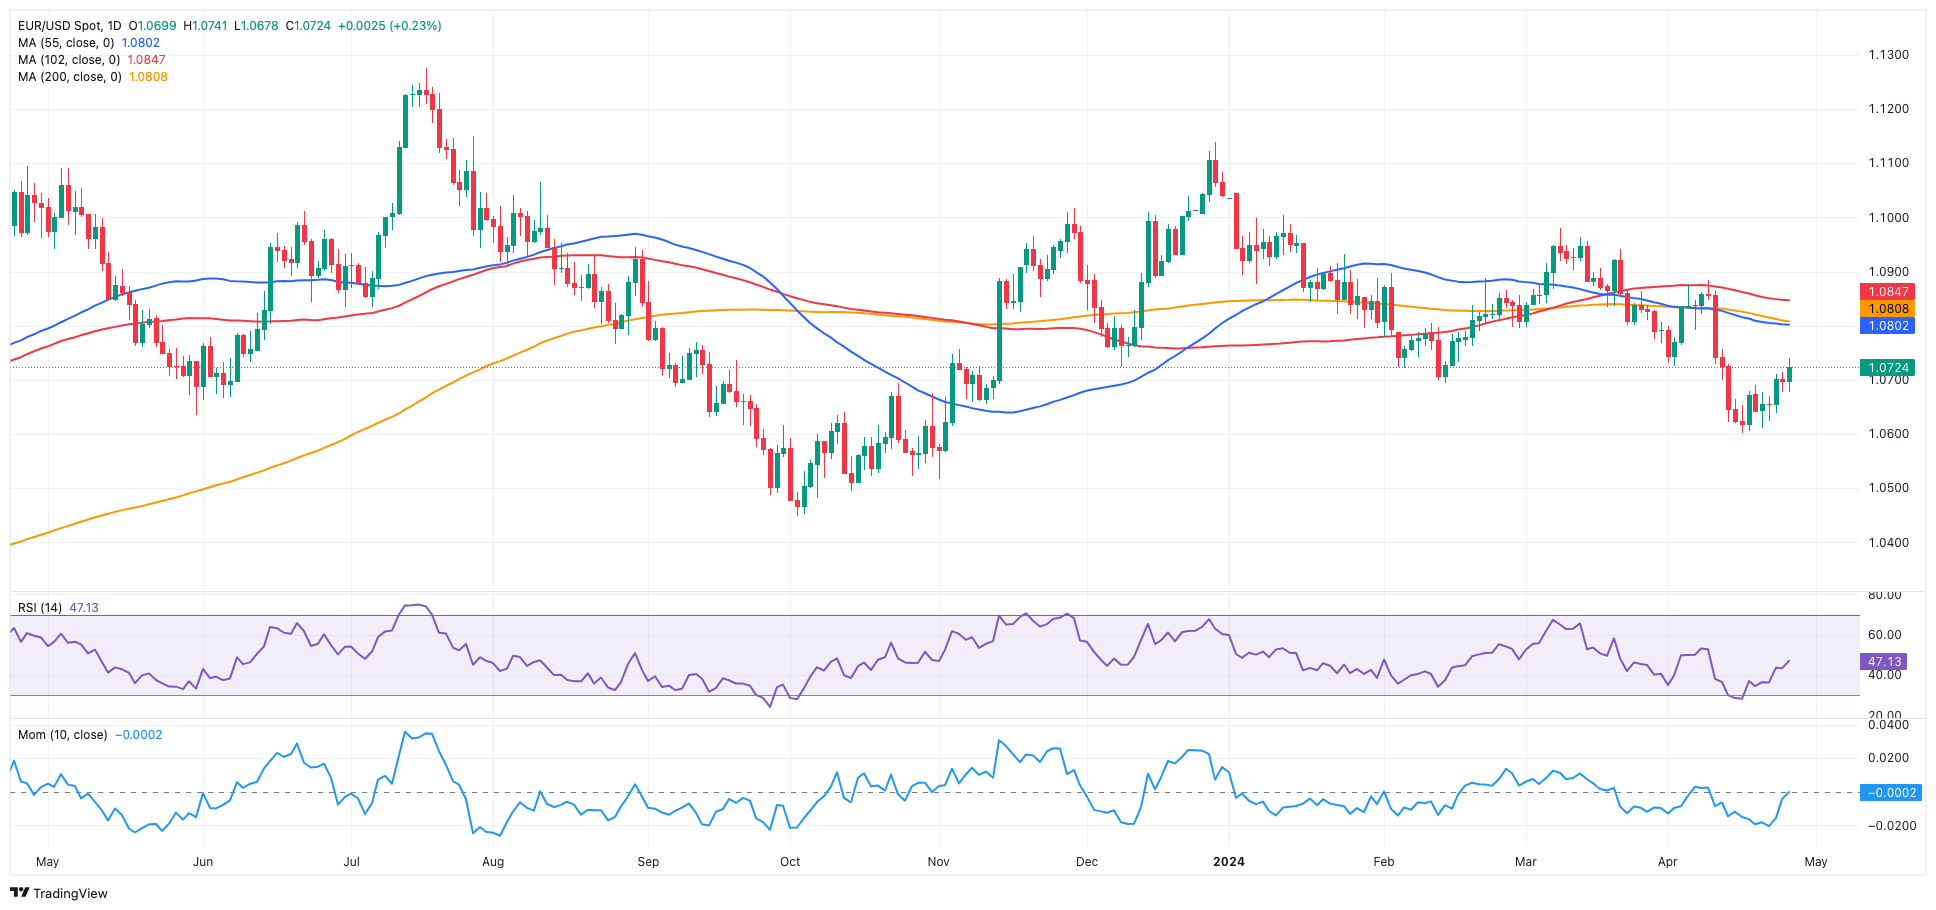
EUR/USD short-term technical outlook
On the upside, EUR/USD is expected to face first resistance at the critical 200-day SMA of 1.0807, seconded by the April peak of 1.0885 (April 9), the March high of 1.0981 (March 8), and the weekly top of 1.0998 (January 11), all before reaching the psychological barrier of 1.1000.
Looking south, the breach of the 2024 low of 1.0601 (April 16) may indicate a return to the November 2023 low of 1.0516 (November 1), which precedes the weekly low of 1.0495 (October 13, 2023). Once this region is achieved, a visit to the 2023 bottom of 1.0448 (October 3) may occur before the round milestone of 1.0400.
The 4-hour chart shows that the bullish trend is still in place. The initial up-barrier is at 1.0740, ahead of 1.0756 and the 200-SMA at 1.0787. Meanwhile, the initial support is the 55-SMA at 1.0661 prior to 1.0601 and followed by 1.0516. The Relative Strength Index (RSI) climbed past 63.
Premium
You have reached your limit of 3 free articles for this month.
Start your subscription and get access to all our original articles.
Author

Pablo Piovano
FXStreet
Born and bred in Argentina, Pablo has been carrying on with his passion for FX markets and trading since his first college years.


