EUR/USD Forecast: Modest bounce before the next leg south

EUR/USD Current price: 1.1368
- EU Q3 Gross Domestic Product was confirmed at 2.2% in the three months to September.
- US October Retail Sales unexpectedly increased by 1.7% MoM, much better than expected.
- EUR/USD recovered modestly from a fresh 2021 low of 1.1350.
The EUR/USD pair remains under selling pressure, trading near a fresh 2021 low of 1.1350. The greenback strengthened unevenly across the FX board, but a dismal mood keeps it on the positive side. Asian and European equities struggle around their opening levels, as US government bond yields retain their Monday’s gains.
Speculative interest is concerned about persistently high inflation and slow employment recovery forcing central banks into tighter monetary policies, while a new coronavirus wave hits Europe. Data-wise, the EU published the second estimate of its Q3 Gross Domestic Product, which was confirmed at 2.2% QoQ. Employment change in the same quarter was up 0.9%, beating expectations.
The US published October Retail Sales, which unexpectedly increased by 1.7% MoM, much better than the 1.2% expected. The core reading, Retail Sales Control Group, printed at 1.6% vs the 0.9% expected. Additionally, the US reported the October Import Price Index and the Export Price Index for the same month, which came in better than anticipated.
The positive US headlines gave a modest boost to the market’s sentiment, which in turn put some pressure on the dollar.
EUR/USD short-term technical outlook
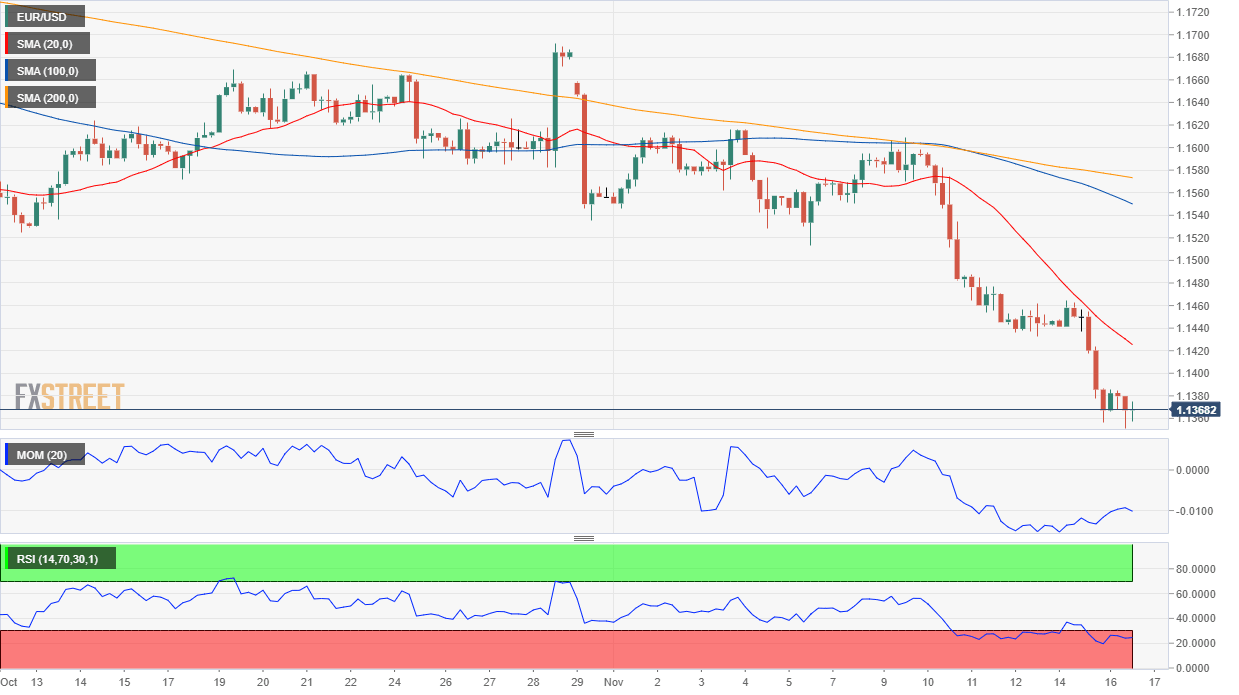
Nevertheless, the EUR/USD pair is trading around 1.1370, not far from its intraday low. The daily chart shows that technical indicators have partially lost their bearish strength within oversold levels, while the pair keeps developing far below all of its moving averages, which maintain their strong bearish slopes.
In the near term, and according to the 4-hour chart, the risk remains skewed to the downside, although a corrective advance is not out of the cards. The pair keeps developing below all of its moving averages, while technical indicators have turned flat, the Momentum within negative levels and the RSI at around 26. A firmly bearish 20 SMA provides dynamic resistance at around 1.1425.
Support levels: 1.1350 1.1310 1.1265
Resistance levels: 1.1425 1.1470 1.1515
Premium
You have reached your limit of 3 free articles for this month.
Start your subscription and get access to all our original articles.
Author

Valeria Bednarik
FXStreet
Valeria Bednarik was born and lives in Buenos Aires, Argentina. Her passion for math and numbers pushed her into studying economics in her younger years.


