EUR/USD Forecast: Euro could stretch lower if 1.0830 support fails
- EUR/USD trades slightly below 1.0850 in the European morning on Monday.
- 1.0830 aligns as important support in the near term.
- US economic docket will feature ISM Manufacturing PMI data for May.

EUR/USD continues to move sideways at around 1.0850 in the European session on Monday after closing the previous week virtually unchanged. 1.0830 aligns as key support and technical sellers could show interest if this level fails.
After the data from the US showed on Friday that inflation, as measured by the change in the Personal Consumption Expenditures (PCE) Price Index, rose 2.7% on a yearly basis in April, matching March's increase and the market expectation. In the same period, the core PCE Price Index increased 2.8% as forecast. These readings made it difficult for the US Dollar to preserve its strength and helped EUR/USD edge higher heading into the weekend.
Euro PRICE Last 7 days
The table below shows the percentage change of Euro (EUR) against listed major currencies last 7 days. Euro was the strongest against the British Pound.
| USD | EUR | GBP | JPY | CAD | AUD | NZD | CHF | |
|---|---|---|---|---|---|---|---|---|
| USD | 0.09% | 0.26% | 0.02% | -0.09% | -0.19% | -0.42% | -1.29% | |
| EUR | -0.09% | 0.14% | -0.03% | -0.18% | -0.35% | -0.60% | -1.36% | |
| GBP | -0.26% | -0.14% | -0.22% | -0.35% | -0.48% | -0.68% | -1.54% | |
| JPY | -0.02% | 0.03% | 0.22% | -0.16% | -0.24% | -0.37% | -1.37% | |
| CAD | 0.09% | 0.18% | 0.35% | 0.16% | -0.12% | -0.33% | -1.28% | |
| AUD | 0.19% | 0.35% | 0.48% | 0.24% | 0.12% | -0.18% | -1.06% | |
| NZD | 0.42% | 0.60% | 0.68% | 0.37% | 0.33% | 0.18% | -0.90% | |
| CHF | 1.29% | 1.36% | 1.54% | 1.37% | 1.28% | 1.06% | 0.90% |
The heat map shows percentage changes of major currencies against each other. The base currency is picked from the left column, while the quote currency is picked from the top row. For example, if you pick the Euro from the left column and move along the horizontal line to the US Dollar, the percentage change displayed in the box will represent EUR (base)/USD (quote).
The US economic docket will feature the ISM Manufacturing PMI data for May later in the day. Investors expect the reading to improve to 49.8 from 49.2 in April. A reading above 50, which would show the business activity moving back into the expansion territory, could support the USD in the second half of the day.
Nevertheless, investors could refrain from taking large positions ahead of the European Central Bank (ECB) monetary policy announcements and the May jobs report from the US in the second half of the week.
EUR/USD Technical Analysis
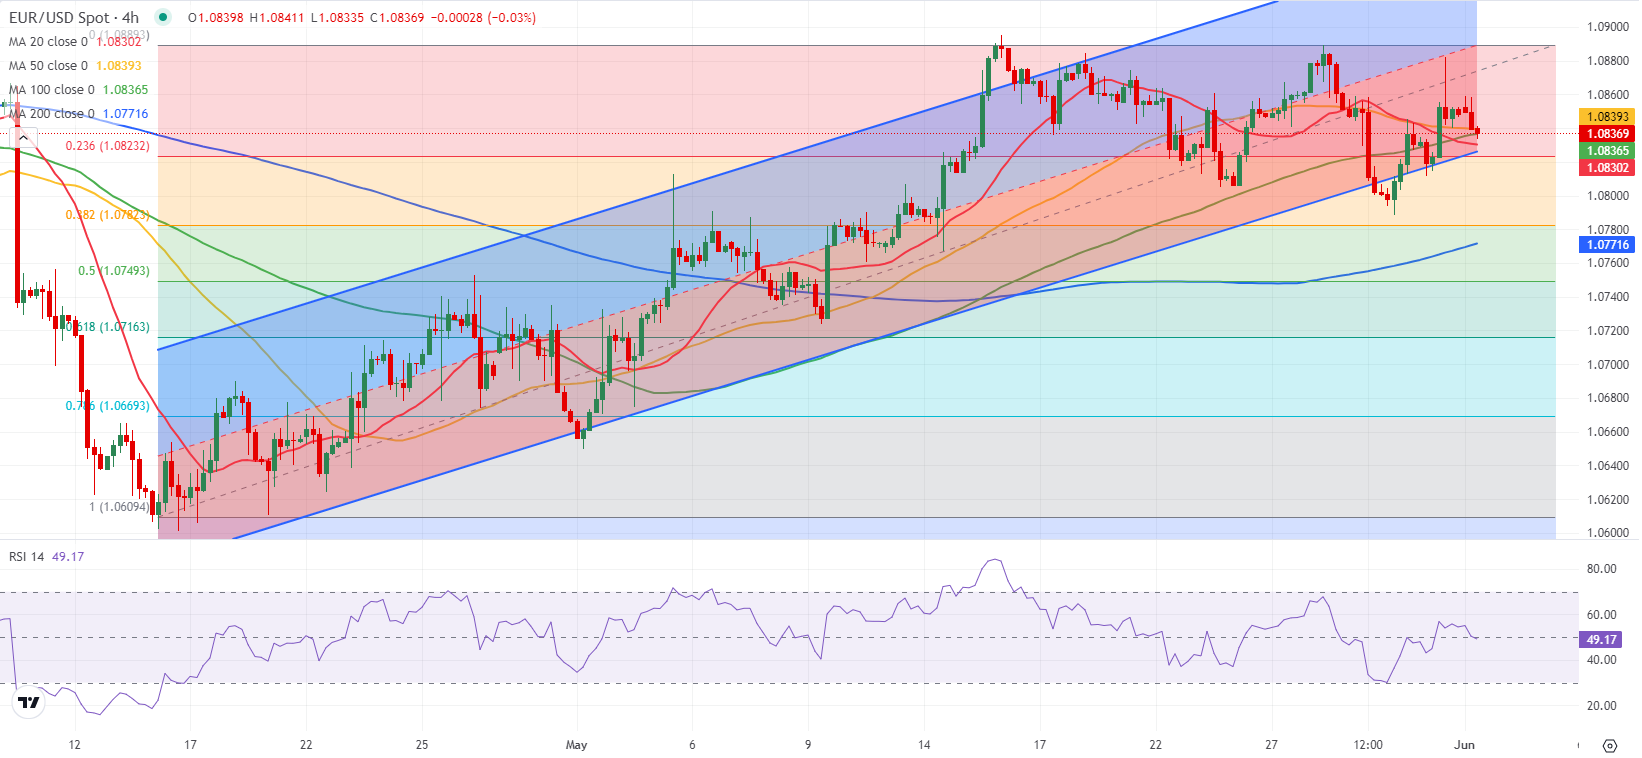
The Fibonacci 23.6% retracement level of the latest uptrend and the lower limit of the ascending regression channel form key support at 1.0830. The 20-day Simple Moving Average (SMA) also reinforces this level. In case EUR/USD drops below 1.0830 and starts using this level as resistance, 1.0800 (psychological level, static level) and 1.0780-1.0770 (Fibonacci 38.2% retracement, 200-period SMA on the 4-hour chart) could be seen as next bearish targets.
On the upside, 1.0850 (static level) aligns as interim resistance before 1.0890-1.0900 (mid-point of the ascending channel, static level).
Economic Indicator
ISM Manufacturing PMI
The Institute for Supply Management (ISM) Manufacturing Purchasing Managers Index (PMI), released on a monthly basis, is a leading indicator gauging business activity in the US manufacturing sector. The indicator is obtained from a survey of manufacturing supply executives based on information they have collected within their respective organizations. Survey responses reflect the change, if any, in the current month compared to the previous month. A reading above 50 indicates that the manufacturing economy is generally expanding, a bullish sign for the US Dollar (USD). A reading below 50 signals that factory activity is generally declining, which is seen as bearish for USD.
Read more.Last release: Wed May 01, 2024 14:00
Frequency: Monthly
Actual: 49.2
Consensus: 50
Previous: 50.3
Source: Institute for Supply Management
The Institute for Supply Management’s (ISM) Manufacturing Purchasing Managers Index (PMI) provides a reliable outlook on the state of the US manufacturing sector. A reading above 50 suggests that the business activity expanded during the survey period and vice versa. PMIs are considered to be leading indicators and could signal a shift in the economic cycle. Stronger-than-expected prints usually have a positive impact on the USD. In addition to the headline PMI, the Employment Index and the Prices Paid Index numbers are watched closely as they shine a light on the labour market and inflation.
Premium
You have reached your limit of 3 free articles for this month.
Start your subscription and get access to all our original articles.
Author

Eren Sengezer
FXStreet
As an economist at heart, Eren Sengezer specializes in the assessment of the short-term and long-term impacts of macroeconomic data, central bank policies and political developments on financial assets.


