EUR/USD Forecast: ECB provides unexpected support

EUR/USD Current Price: 1.0755
- The ECB downwardly revises growth figures but pushes up inflation ones.
- European policymakers hinted at a 25 bps rate hike in July and another in September.
- EUR/USD has turned bullish in the near term but remains below a critical resistance level.
The EUR/USD pair trades with modest gains in the 1.0760 price zone, volatile in the middle of the European Central Bank monetary policy decision. The central bank has maintained rates on hold, as expected while anticipating a 25 bps hike in July. The pair fell to 1.0687 but quickly recovered from the level, despite policymakers upwardly reviewing inflation figures.
Annual inflation is now seen at 6.8% for this year, then decreasing to 3.5% in 2023 and to 2.1% in 2024. Growth has been downwardly revised to 2.8% in 2022 and to 2.1% for the next two years. Additionally, another rate hike is planned for September, and the scale of the increment would depend on the medium-term inflation outlook.
ECB President Christine Lagarde is giving a speech, which could spur more volatility around the pair, particularly within the Q&A. In the meantime, the US published Initial Jobless Claims for the week ended June 3, which were up to 229K, worse than anticipated.
EUR/USD short-term technical outlook
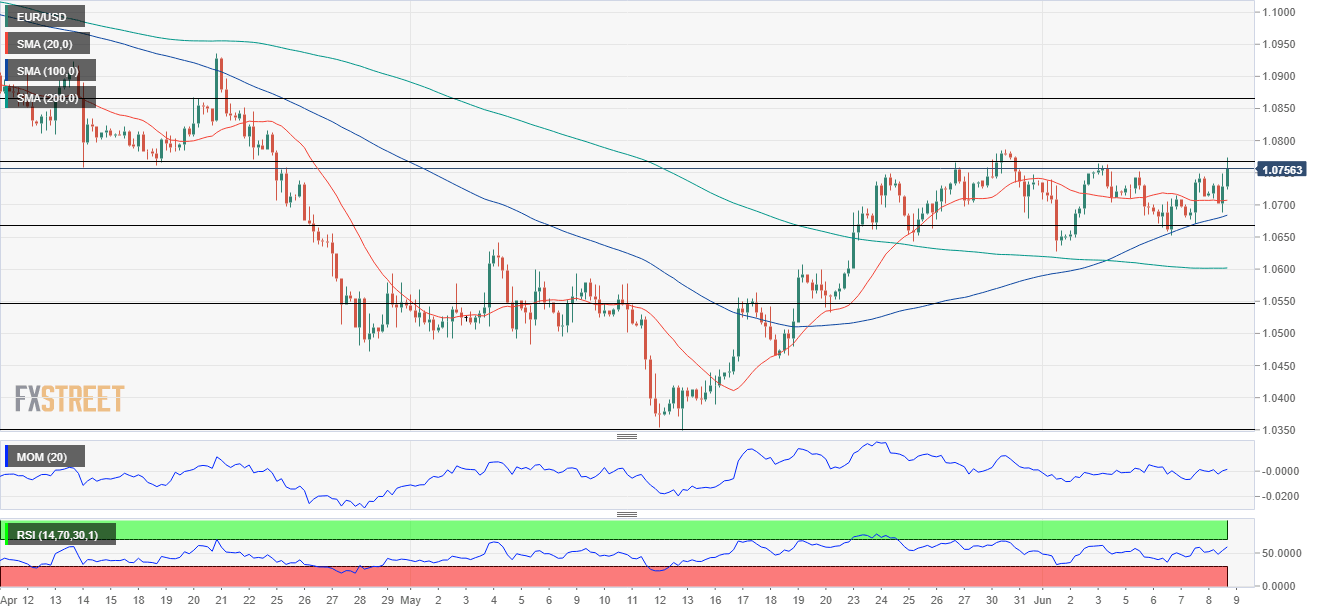
The EUR/USD pair trades around the 50% retracement of its latest daily slump, at 1.0770, also near the May high at 1.0780. According to the daily chart, the risk is now skewed to the upside. Technical indicators have turned higher within positive levels, reflecting increased buying interest. At the same time, the 20 SMA maintains its bullish slope below the current level, approaching the 38.2% retracement of the aforementioned decline at 1.0665.
The 4-hour chart shows that the bullish momentum picked up, as technical indicators head firmly north within positive levels and at their highest for this week. The 100 SMA keeps advancing below the current level while the pair rallies above a flat 20 SMA. The pair has room to extend its gains once above the 1.0780 region, aiming then for the next Fibonacci resistance at 1.0860.
Support levels: 1.0710 1.0665 1.0620
Resistance levels: 1.0780 1.0815 1.0860
Premium
You have reached your limit of 3 free articles for this month.
Start your subscription and get access to all our original articles.
Author

Valeria Bednarik
FXStreet
Valeria Bednarik was born and lives in Buenos Aires, Argentina. Her passion for math and numbers pushed her into studying economics in her younger years.


