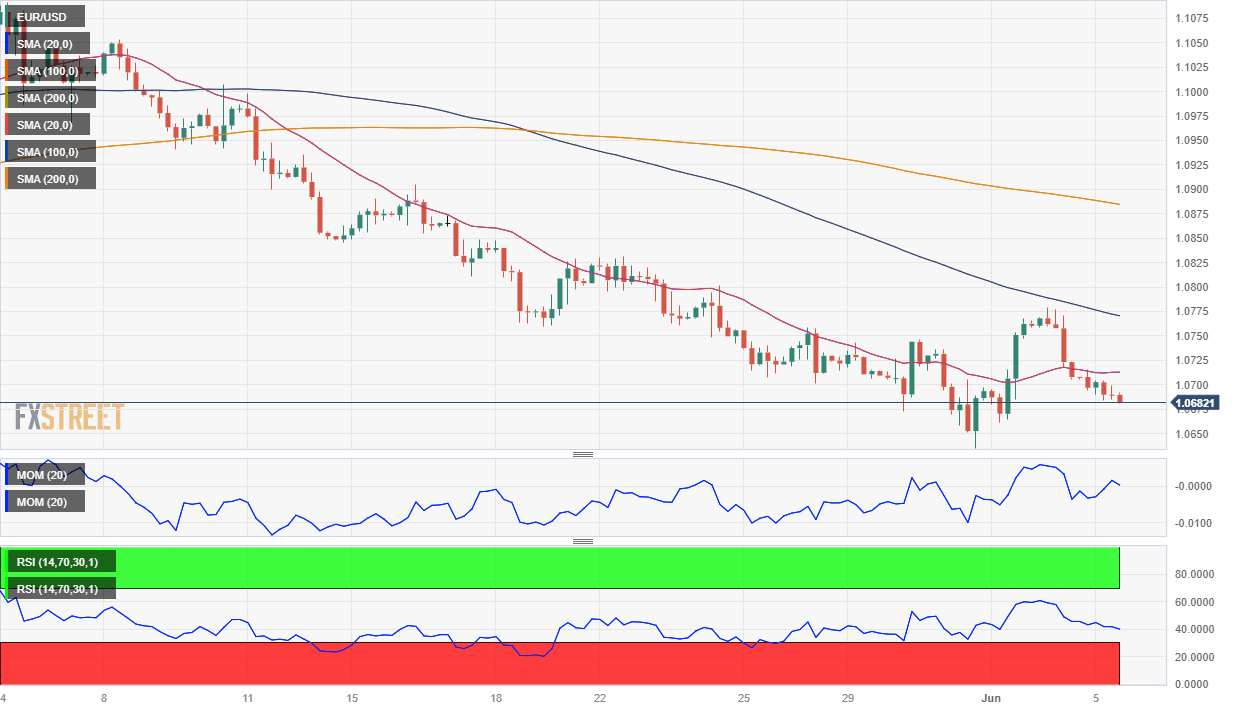
EUR/USD Current Price: 1.0681
- S&P Global downwardly revised the May EU Services PMIs.
- Stock markets struggle to retain the green as government bond yields jump.
- EUR/USD bearish case firmer as the pair approaches a two-month low.
The EUR/USD pair remains under selling pressure as the US Dollar retains its strength, currently trading at around 1.0680. Following the upbeat United States (US), Nonfarm Payrolls report (NFP) published on Friday and comments from different Federal Reserve (Fed) officials, market participants now believe the Fed would pause in June but leave the door open for additional hikes in the future.
The week started with mild optimism, which seems to fade as the day passes. Major Asian stock markets posted substantial gains, but European indexes struggle to remain afloat. At the same time, Wall Street futures show little change from Friday’s closing levels and are set to open flat.
Meanwhile, government bond yields extend their latest advance. The 2-year Treasury note added 5 basis points (bps) ahead of the US opening and currently offers 4.55%, while the 10-year note yields 3.75%.
Data-wise, S&P Global published the final estimates of its May PMIs for the Union. Services output was downwardly revised in all major economies, leading to the EU Services PMI being confirmed at 55.1, below the previous estimate of 55.9. Despite the revisions, all indexes remained in expansionary territory, having a limited impact on the Euro. On a negative note, EU Sentix Investor Confidence declined in June to -17 from -13.1 in May, while the April Producer Price Index (PPI) rose by 1% YoY, well below the previous 5.9%.
S&P Global will release the final estimates of the May US Services and Composite PMIs, while the country will publish the official ISM Services PMI for the same month. The macroeconomic calendar also includes April Factory Orders.
EUR/USD short-term technical outlook
The EUR/USD pair trades with modest losses, not far above the two-month low posted last week at 1.0634. Technical readings in the daily chart favor a downward extension as a bearish 20 Simple Moving Average (SMA) heads south below a flat 100 SMA, both above the current level. Also, the pair remains below a critical static support level, the 61.8% Fibonacci retracement of the 2022 yearly slump at 1.0745. Finally, technical indicators remain within negative levels, with neutral-to-bearish slopes.
The near-term picture is bearish. In the 4-hour chart, a mildly bearish 20 SMA provides intraday resistance at around 1.0710, while the longer moving averages accelerate their slides far above the shorter one. At the same time, the Momentum indicator grinds lower within neutral levels, while the Relative Strength Index (RSI) indicator heads firmly south at around 41, reflecting prevalent selling interest.
Support levels: 1.0635 1.0590 1.0550
Resistance levels: 1.0710 1.0745 1.0790
Information on these pages contains forward-looking statements that involve risks and uncertainties. Markets and instruments profiled on this page are for informational purposes only and should not in any way come across as a recommendation to buy or sell in these assets. You should do your own thorough research before making any investment decisions. FXStreet does not in any way guarantee that this information is free from mistakes, errors, or material misstatements. It also does not guarantee that this information is of a timely nature. Investing in Open Markets involves a great deal of risk, including the loss of all or a portion of your investment, as well as emotional distress. All risks, losses and costs associated with investing, including total loss of principal, are your responsibility. The views and opinions expressed in this article are those of the authors and do not necessarily reflect the official policy or position of FXStreet nor its advertisers. The author will not be held responsible for information that is found at the end of links posted on this page.
If not otherwise explicitly mentioned in the body of the article, at the time of writing, the author has no position in any stock mentioned in this article and no business relationship with any company mentioned. The author has not received compensation for writing this article, other than from FXStreet.
FXStreet and the author do not provide personalized recommendations. The author makes no representations as to the accuracy, completeness, or suitability of this information. FXStreet and the author will not be liable for any errors, omissions or any losses, injuries or damages arising from this information and its display or use. Errors and omissions excepted.
The author and FXStreet are not registered investment advisors and nothing in this article is intended to be investment advice.
Recommended Content
Editors’ Picks
AUD/USD clings to recovery gains above 0.6200, focus shifts to US ISM PMI
AUD/USD sustains the recovery from two-year troughs, holding above 0.6200 in Friday's Asian trading. The pair finds footing amid a pause in the US Dollar advance but the upside appears elusive as markets turn cautious amid China concerns and ahead of US ISM PMI data.
USD/JPY eases toward 157.00 as risk sentiment sours
USD/JPY is extending pullback from multi-month high of 158.07 set on Thursday. The pair drops toward 157.00 in the Asian session on Friday, courtesy of the negative shift in risk sentiment. Markets remain concerned about China's econmic health and the upcoming policies by the Fed and the BoJ.
Gold price appreciates amid Biden's discussions about potential strikes on Iran
Gold price edges higher for the fourth consecutive session on Friday, building on a stellar performance in 2024 with gains exceeding 27%, the metal’s best annual return since 2010. This sustained rally is attributed to strong safe-haven demand amid persistent geopolitical tensions in the Middle East and the prolonged Russia-Ukraine conflict.
Bitcoin, Ethereum and Ripple eyes for a rally
Bitcoin’s price finds support around its key level, while Ethereum’s price is approaching its key resistance level; a firm close above it would signal a bullish trend. Ripple price trades within a symmetrical triangle on Friday, a breakout from which could signal a rally ahead.
Three Fundamentals: Year-end flows, Jobless Claims and ISM Manufacturing PMI stand out Premium
Money managers may adjust their portfolios ahead of the year-end. Weekly US Jobless Claims serve as the first meaningful release in 2025. The ISM Manufacturing PMI provides an initial indication ahead of Nonfarm Payrolls.
Best Forex Brokers with Low Spreads
VERIFIED Low spreads are crucial for reducing trading costs. Explore top Forex brokers offering competitive spreads and high leverage. Compare options for EUR/USD, GBP/USD, USD/JPY, and Gold.