EUR/USD Elliott Wave: Wave (iii) peak confirmed – Consolidation unfolding as Wave (iv) develops

The EUR/USD bullish momentum has recently stalled just shy of the 1.1650 handle, confirming the completion of what now appears to be wave (iii) of a higher-degree impulse. Earlier, there was the possibility that the latest rally was a fifth-wave extension of wave (iii), but recent price action and sentiment shifts suggest otherwise.
Following a textbook extended wave (iii), EUR/USD is now undergoing a corrective phase, likely the unfolding of wave (iv), as shown in the 4H chart. The outlook remains bullish overall, but the near-term path depends heavily on the structure of this developing wave (iv).
Current Wave count (four-hour chart)
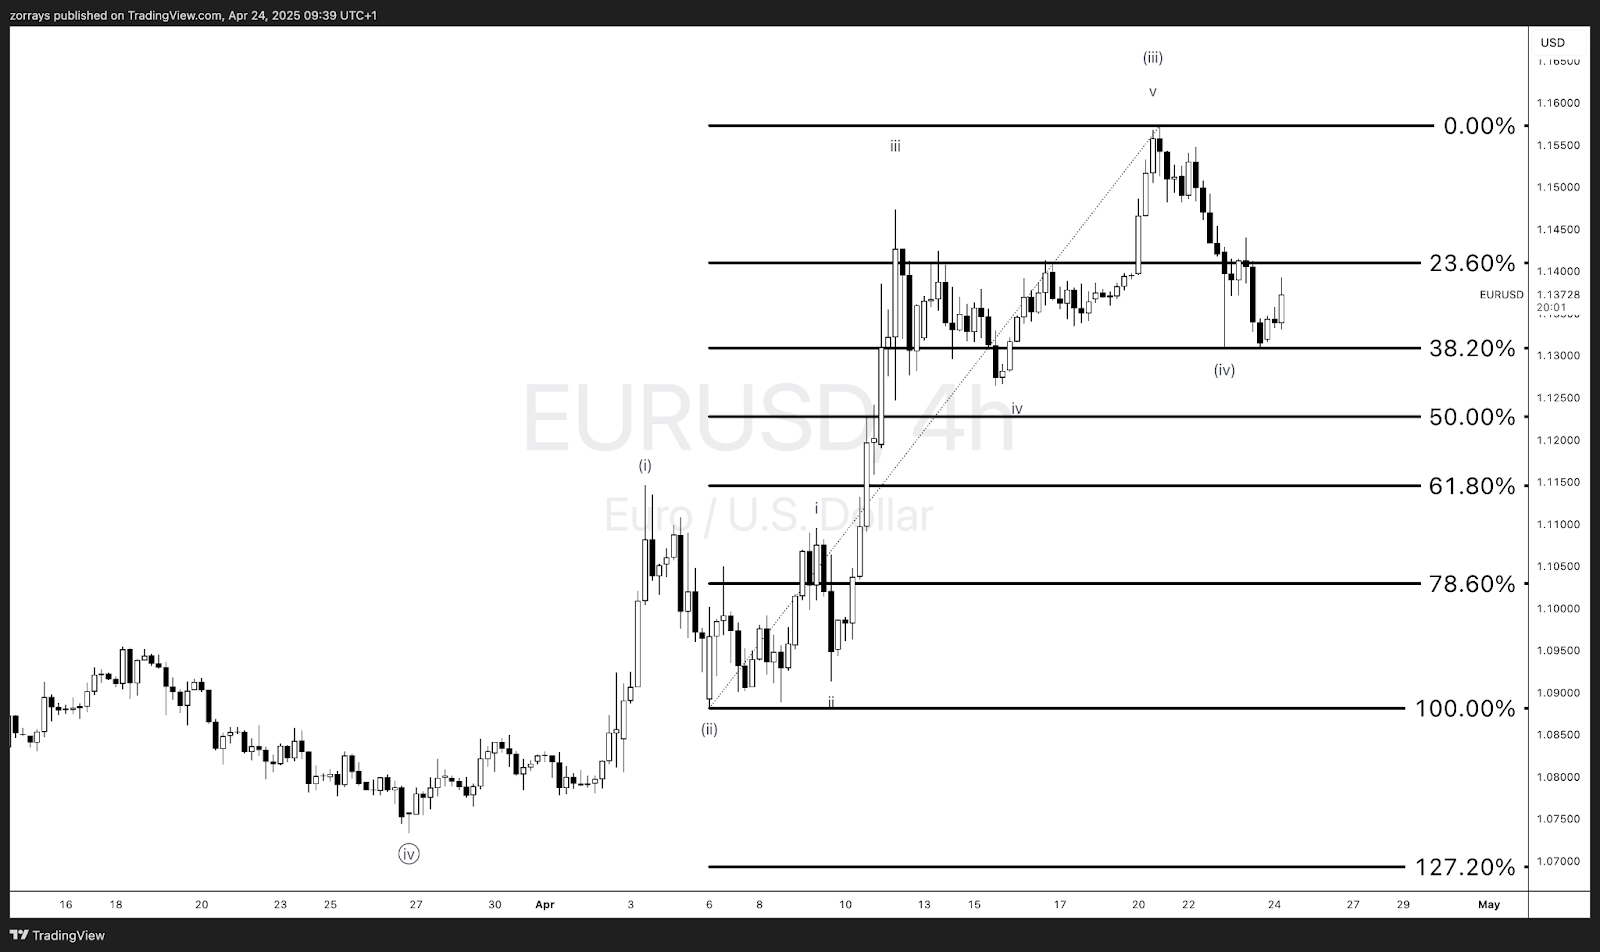
We're currently operating under the assumption that EUR/USD has completed a 5-wave rally from the April 2 low, with the following breakdown:
- Wave (i): Sparked a breakout through the late March range, establishing the bullish structure.
- Wave (ii): Shallow retracement—potentially a flat or zigzag correction—confirming bullish undercurrents.
- Wave (iii): A strong, impulsive extension culminating just under 1.1650. Price action exhibited classic third-wave acceleration, with minimal pullbacks and strong directional follow-through.
- Wave (iv) (in progress): Currently correcting the prior move. So far, there's no overlap with wave (i), keeping the impulsive count valid. The structure hints at a potential running flat or triangle, but confirmation is still pending.
- Wave (v) (pending): Expected to unfold after wave (iv) completion, with projected targets in the 1.1650–1.1720zone, derived from Fibonacci extensions.
Refer to the chart below for visual reference of this wave structure:
Revised outlook: Why the fifth wave count for (iii) was reconsidered
Initially, there was a compelling case for the final rally into 1.1650 being a fifth-wave extension of wave (iii), especially given its sharp move and momentum signature. However, price failed to push higher in a sustained manner, and the reversal from that level suggests it capped off wave (iii) instead.
Furthermore, recent euro bullishness has not been fundamentally driven. The upside has stalled in the face of slightly more hawkish tones from the ECB, and the broader move has largely reflected USD weakness, not EUR strength.
Alternate view
Should EUR/USD break down impulsively below 1.1340–1.1320, this would undermine the bullish count and open the possibility of:
- A larger corrective flat or expanded flat playing out in a broader A-B-C fashion.
- The initial advance from April representing a C-wave of a larger correction, not a motive wave.
Until then, the base case remains a 5-wave impulsive count, with wave (iv) still in formation.
Macro backdrop: Sentiment-driven USD weakness still central
The recent euro rally owes more to the dollar’s vulnerability than eurozone resilience. USD pressure remains high amid:
- Renewed political heat on the Fed, especially with U.S. elections drawing closer.
- A growing credibility gap in U.S. economic management, prompting investors to diversify out of USD.
- Rate cut expectations being pulled forward amid mixed U.S. data and dovish rhetoric.
In this climate, EUR/USD is benefiting as a reserve alternative, but upside should be viewed with caution. Any hawkish surprise from the Fed or rebound in U.S. data could stall the euro’s advance.
Conclusion
EUR/USD has completed wave (iii) and is currently correcting in what appears to be wave (iv). As long as support above 1.1320 holds and no impulsive breakdown occurs, the next leg higher into 1.1650–1.1720 remains the likely path under wave (v). However, traders should be cautious of the broader macro backdrop, which continues to weigh heavily on USD sentiment rather than offering true support to the euro.
We continue to monitor the unfolding wave (iv) for further clarity. Key zones for invalidation and breakout remain:
- Support: 1.1340 (invalidates impulsive count if broken impulsively).
- Resistance: 1.1580 (break above could indicate early wave (v) underway).
Author

Zorrays Junaid
Alchemy Markets
Zorrays Junaid has extensive combined experience in the financial markets as a portfolio manager and trading coach. More recently, he is an Analyst with Alchemy Markets, and has contributed to DailyFX and Elliott Wave Forecast in the past.


