EUR/USD Elliott Wave technical analysis [Video]
![EUR/USD Elliott Wave technical analysis [Video]](https://editorial.fxsstatic.com/images/i/EURUSD-neutral-object_XtraLarge.png)
EUR/USD Elliott Wave technical analysis
-
Function: Bullish Trend.
-
Mode: Impulsive.
-
Structure: Orange Wave 3.
-
Position: Navy Blue Wave 1.
-
Direction next higher degrees: Orange Wave 3 (Started).
Details:
-
Orange Wave 2 of Navy Blue Wave 1 appears completed.
-
Orange Wave 3 is now in play.
-
Wave Cancel Invalidation Level: 1.02098
Market overview
The EURUSD daily chart analysis based on Elliott Wave Theory indicates a bullish trend in an impulsive mode. The current wave structure highlights Orange Wave 3, which has commenced following the completion of Orange Wave 2 within Navy Blue Wave 1. This progression suggests a continuation of upward momentum and potential further price advances.
Navy Blue Wave 1 represents a crucial phase in the broader bullish movement. With Orange Wave 3 now active, traders should expect increased market activity and stronger price movements, which are common during this stage. The completion of Orange Wave 2 establishes a solid base for continued upward movement.
Technical insights
The emergence of Orange Wave 3 signifies a key bullish phase, suggesting that the market has further upside potential. The wave cancel invalidation level is set at 1.02098, meaning that if the price drops below this threshold, the current wave count would be invalidated, requiring a reassessment of the market scenario.
Conclusion
The EURUSD daily chart maintains a bullish outlook, with Orange Wave 3 actively progressing, indicating continued upward movement. The completion of Orange Wave 2 within Navy Blue Wave 1 reinforces this positive market trend.
Market participants should closely monitor price fluctuations and keep an eye on the invalidation level to confirm the prevailing trend or adjust strategies accordingly. This analysis underscores the bullish momentum currently influencing EURUSD, providing key insights into its market dynamics.
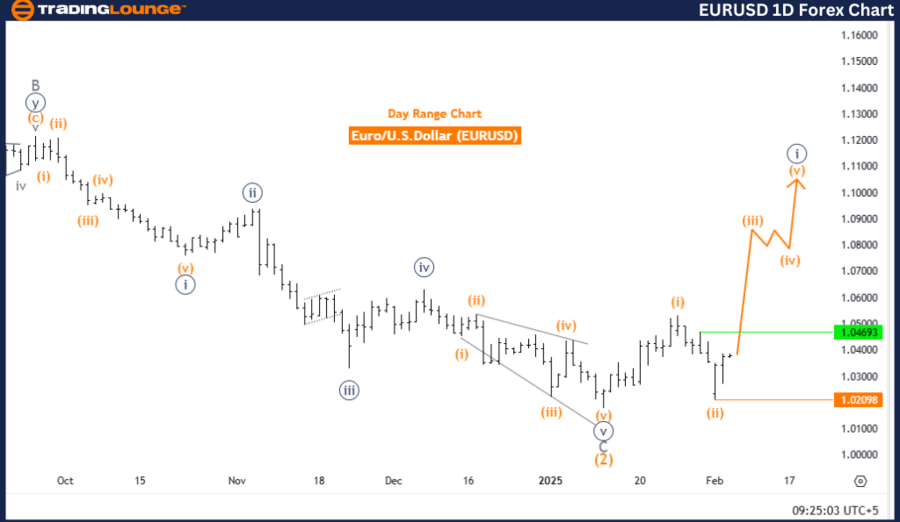
EUR/USD day chart analysis
EUR/USD Elliott Wave technical analysis
-
Function: Bullish Trend.
-
Mode: Impulsive.
-
Structure: Orange Wave 3.
-
Position: Navy Blue Wave 1.
-
Direction Next Higher Degrees: Orange Wave 3 (Started).
Details:
-
Orange Wave 2 of Navy Blue Wave 1 appears completed.
-
Orange Wave 3 is now in play.
-
Wave Cancel Invalidation Level: 1.02098
Market overview
The EURUSD 4-hour chart analysis based on Elliott Wave Theory confirms a bullish trend in an impulsive mode. The current wave structure focuses on Orange Wave 3, which has begun after the completion of Orange Wave 2 within Navy Blue Wave 1. This movement suggests a continuation of the upward trajectory with the potential for further price gains.
The Navy Blue Wave 1 represents the early phase of a larger bullish cycle. As Orange Wave 3 unfolds, traders should anticipate stronger momentum and increased price volatility, which are typical characteristics of this wave phase. The completion of Orange Wave 2 provides a stable base for continued bullish movement.
Technical insights
The Orange Wave 3 phase plays a crucial role in the current Elliott Wave cycle. It signals further upside potential in the market structure. The wave cancel invalidation level is set at 1.02098, meaning that if the price drops below this level, the current wave count becomes invalid, requiring a reassessment of the market outlook.
Conclusion
The EURUSD 4-hour chart maintains a bullish trend, with Orange Wave 3 actively progressing, indicating continued upward movement. The completion of Orange Wave 2 within Navy Blue Wave 1 further reinforces the bullish outlook.
Traders should closely observe price movements and be mindful of the invalidation level to confirm the ongoing trend or adjust trading strategies if necessary. This analysis provides key insights into the market dynamics and highlights the bullish trajectory of EURUSD.
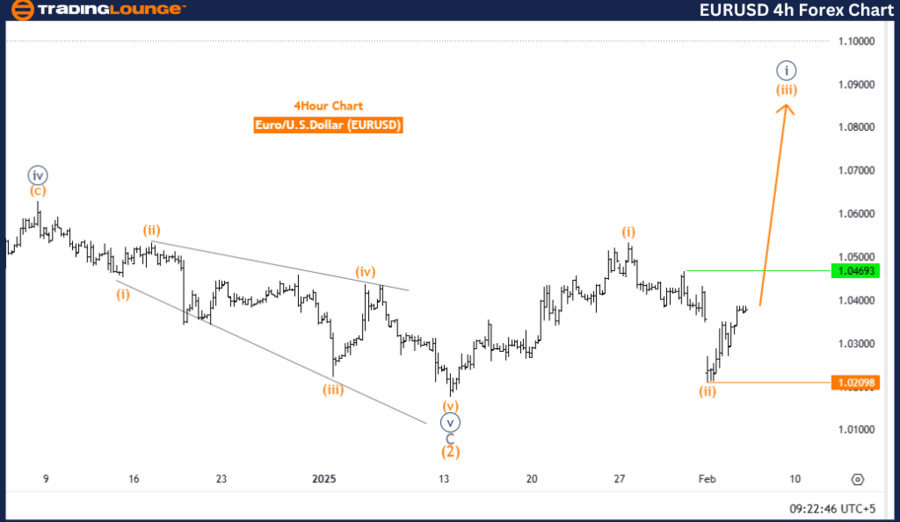
EUR/USD four-hour chart analysis
EUR/USD Elliott Wave technical analysis [Video]
Author

Peter Mathers
TradingLounge
Peter Mathers started actively trading in 1982. He began his career at Hoei and Shoin, a Japanese futures trading company.


