EUR/USD Elliott Wave technical analysis [Video]
![EUR/USD Elliott Wave technical analysis [Video]](https://editorial.fxsstatic.com/images/i/EURUSD_XtraLarge.png)
EURUSD Elliott Wave Analysis Trading Lounge.
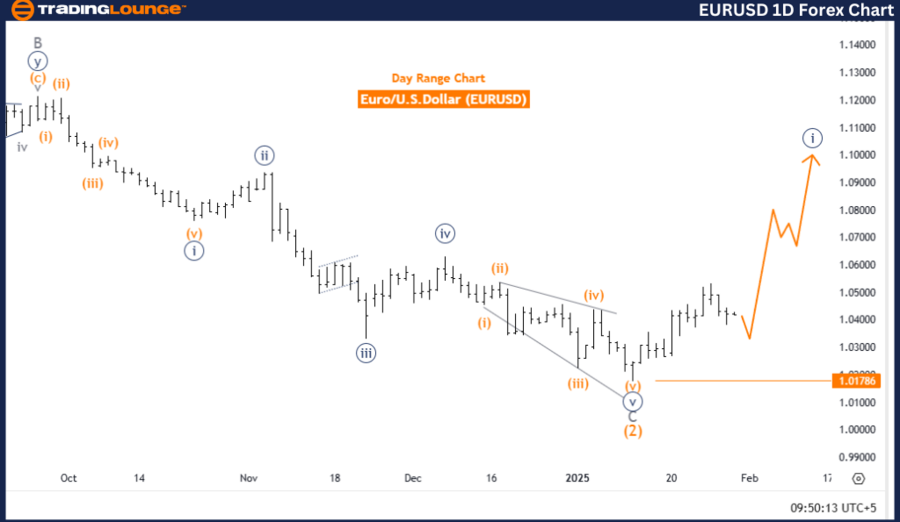
Euro/ U.S. Dollar (EURUSD) Day Chart.
EUR/USD Elliott Wave technical analysis
-
Function: Bullish Trend.
-
Mode: Impulsive.
-
Structure: Navy Blue Wave 1.
-
Position: Gray Wave 1.
-
Direction next higher degrees: Navy Blue Wave (Started).
-
Details: Navy Blue Wave 1 of Gray Wave 1 as a new trend is in play.
-
Wave cancellation invalid level: 1.01786.
The EURUSD Elliott Wave Analysis on the daily chart provides a detailed technical outlook for the Euro/US Dollar currency pair. The analysis classifies the market phase as a bullish trend, indicating strong upward momentum. The impulsive mode suggests the market is in a sustained directional movement rather than a corrective or sideways pattern.
The current wave structure is labeled Navy Blue Wave 1, which is part of a larger Elliott Wave cycle. This wave exists within Gray Wave 1, signifying it as a sub-wave within a higher-degree trend.
The analysis points out that Navy Blue Wave 1 of Gray Wave 1 is actively developing, marking the beginning of a new trend. This implies that the market is in the early stages of a significant bullish movement. The next higher-degree direction is identified as the start of Navy Blue Wave, which aligns with the overall bullish trend.
A key aspect of this analysis is the wave cancellation invalid level, set at 1.01786. If the price drops below this threshold, the current wave structure becomes invalid, necessitating a reassessment of the Elliott Wave count.
Summary
-
The EURUSD is currently in an impulsive bullish phase, labeled Navy Blue Wave 1, forming part of a larger trend within Gray Wave 1.
-
This development suggests the initiation of a new upward trend.
-
Traders should closely monitor the wave's progress, as it provides insights into potential price movements.
-
The 1.01786 invalidation level serves as a critical confirmation point for validating the current Elliott Wave structure.
This analysis serves as a valuable framework for understanding the current market position and forecasting potential price actions within the context of an ongoing bullish trend.
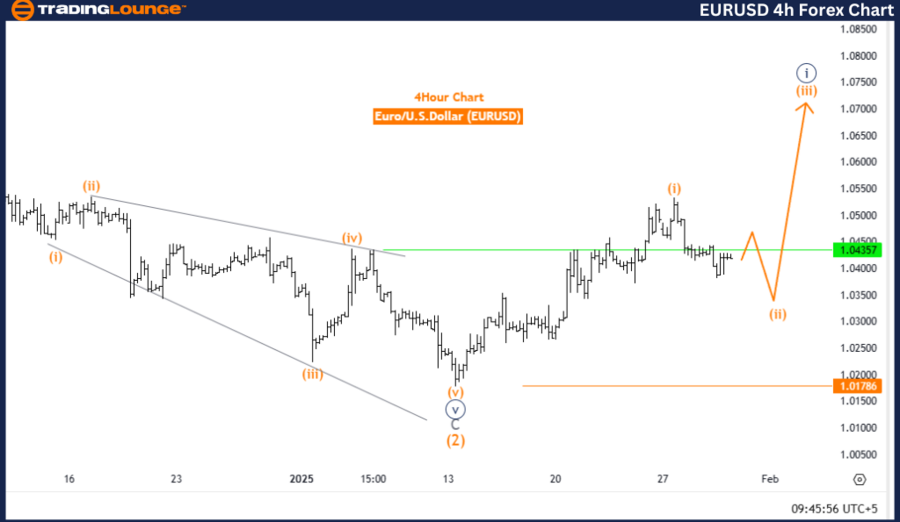
Euro/ U.S. Dollar (EURUSD) 4-Hour Chart
EUR/USD Elliott Wave technical analysis
-
Function: Counter-Trend.
-
Mode: Corrective.
-
Structure: Orange Wave 2.
-
Position: Navy Blue Wave 1.
-
Direction next higher degrees: Orange Wave 3.
-
Details: Orange Wave 1 of Navy Blue Wave 1 appears completed, now Orange Wave 2 is in progress.
-
Wave cancellation invalid level: 1.01786.
The EURUSD Elliott Wave Analysis on the 4-hour chart provides an in-depth technical outlook for the Euro/US Dollar currency pair. The current market phase is classified as a counter-trend movement, indicating a temporary price reversal within the broader trend. The corrective mode suggests that the market is in retracement or consolidation, rather than continuing the primary trend.
The corrective phase is labeled Orange Wave 2, which is a part of a larger Elliott Wave cycle. It is positioned within Navy Blue Wave 1, indicating its role as a sub-wave within a higher-degree trend.
The analysis highlights that Orange Wave 1 of Navy Blue Wave 1 appears to have completed, and the market is now forming Orange Wave 2. This phase is currently unfolding, and traders should carefully track its development. The next expected move in the higher-degree trend is Orange Wave 3, which typically indicates strong directional movement following the corrective phase.
Additionally, a wave cancellation invalidation level is set at 1.01786. If the price moves beyond this level, the current wave count becomes invalid, requiring a reassessment of the Elliott Wave structure.
Summary
-
The EURUSD is in a corrective phase, identified as Orange Wave 2, which is part of a larger counter-trend movement within Navy Blue Wave 1.
-
Once Orange Wave 2 completes, the market is expected to transition into Orange Wave 3, potentially signaling the resumption of the broader trend.
-
Traders should closely monitor the completion of the corrective phase and keep an eye on the invalidation level at 1.01786 to confirm the validity of the current wave structure.
This technical analysis provides traders with a clear framework for understanding the current market position and anticipating future price movements in the EURUSD pair.
Technical analyst: Malik Awais.
EUR/USD Elliott Wave technical analysis [Video]
Author

Peter Mathers
TradingLounge
Peter Mathers started actively trading in 1982. He began his career at Hoei and Shoin, a Japanese futures trading company.


