EUR/USD Elliott Wave technical analysis [Video]
![EUR/USD Elliott Wave technical analysis [Video]](https://editorial.fxstreet.com/images/Markets/Currencies/Majors/EURUSD/euro-or-dollar-3353142_XtraLarge.jpg)
EURUSD Elliott Wave Analysis Trading Lounge.
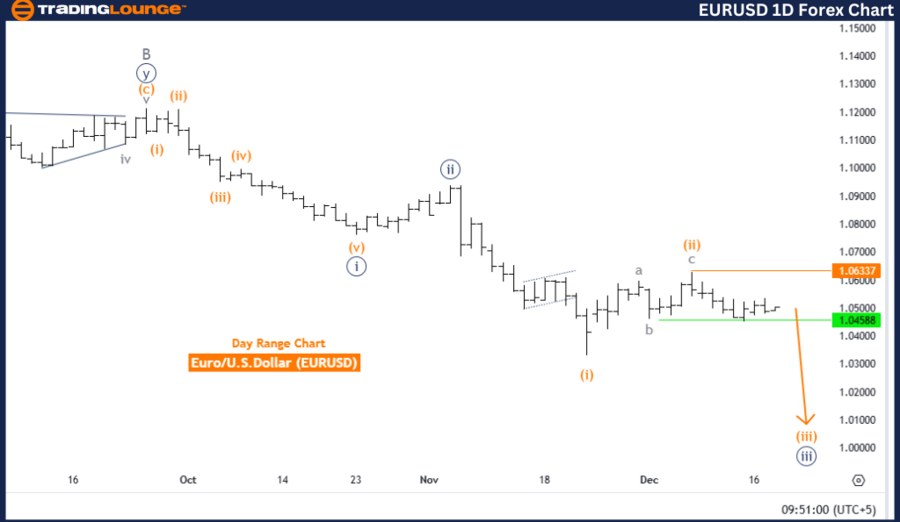
Euro/U.S. Dollar (EURUSD) Day Chart.
EUR/USD Elliott Wave technical analysis
-
Function: Bearish Trend.
-
Mode: Impulsive.
-
Structure: Orange Wave 3.
-
Position: Navy Blue Wave 3.
-
Direction next lower degrees: Orange Wave 3 (Started).
-
Details: Orange wave 2 is considered complete. Currently, orange wave 3 of navy blue wave 3 is in progress.
-
Wave cancel invalid level: 1.06337
The EURUSD daily chart analysis suggests a bearish trend based on Elliott Wave principles. The present wave structure exhibits an impulsive nature, indicating strong downward momentum in the market.
The analysis points to the ongoing development of orange wave 3, which is a segment of the larger navy blue wave 3, emphasizing the continuation of bearish dynamics.
-
Orange wave 2 appears to have concluded, marking the end of a corrective phase.
-
Following this completion, the market has shifted into orange wave 3, an impulsive wave currently unfolding, reflecting intensified bearish momentum with consistent downward movement.
The market’s current positioning within navy blue wave 3 aligns with the active progression of orange wave 3, reinforcing the dominance of bearish forces on both intermediate and larger wave degrees. This ongoing trend implies that the market is poised for further declines as the wave structure advances.
The wave cancel invalid level is set at 1.06337. A move above this level would invalidate the current Elliott Wave count, prompting a reassessment of the analysis. This level is a critical risk management point for traders and analysts observing the bearish scenario.
Summary
The EURUSD daily chart analysis reaffirms a strong bearish trend, highlighted by:
-
The conclusion of orange wave 2.
-
The active progression of orange wave 3 within navy blue wave 3.
The impulsive nature of the wave structure indicates sustained downward movement, while the invalidation level at 1.06337 serves as a key benchmark for assessing potential shifts in market dynamics.
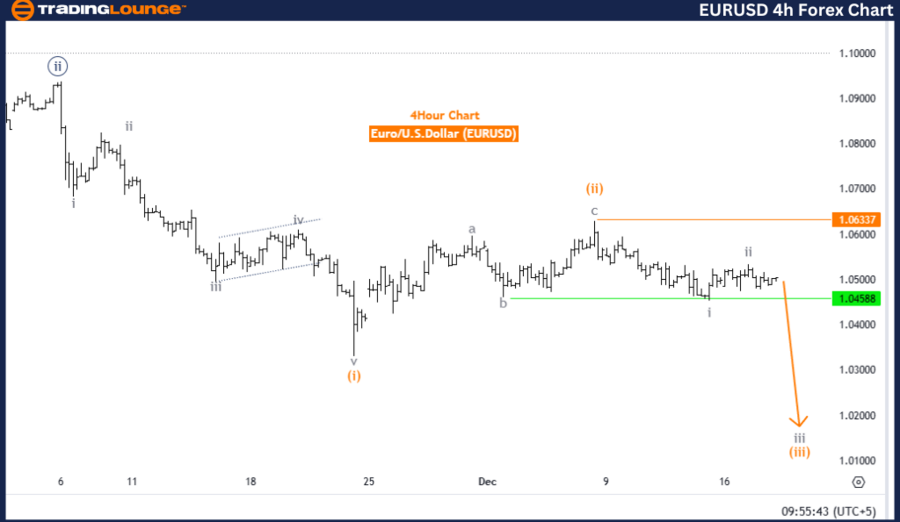
Euro/U.S. Dollar (EURUSD) four-hour chart.
EUR/USD Elliott Wave technical analysis
-
Function: Bearish Trend.
-
Mode: Impulsive.
-
Structure: Gray Wave 3.
-
Position: Orange Wave 3.
-
Direction next lower degrees: Gray Wave 3 (Started).
-
Details: Gray wave 2 is considered complete. Currently, gray wave 3 is actively unfolding.
-
Wave cancel invalid level: 1.06337.
The EURUSD 4-hour chart analysis adheres to Elliott Wave principles, confirming a bearish trend in the market. The ongoing wave structure remains in an impulsive phase, signaling strong downward momentum. The key focus lies on gray wave 3, which is actively advancing, underscoring a continuation of the bearish market phase.
-
Gray wave 2 has been completed, marking the conclusion of a corrective phase.
-
With this, the market has entered gray wave 3, an impulsive wave characterized by a dominant bearish sentiment and strong downward movement, emphasizing the likelihood of further declines.
The market’s positioning within orange wave 3 aligns with the development of gray wave 3, reinforcing the continued downward momentum as the bearish trend persists. The next lower degree wave points towards gray wave 3, with no immediate signs of reversal, maintaining a bearish trajectory.
The wave cancel invalid level is set at 1.06337. A move above this threshold would invalidate the current Elliott Wave count and necessitate a re-evaluation of the wave structure. This invalidation level is a crucial marker for traders to manage risk and confirm the prevailing bearish outlook.
Summary
The EURUSD 4-hour chart analysis supports a strong bearish trend, featuring:
-
The completion of gray wave 2.
-
The active progression of gray wave 3, signaling sustained downward movement.
Traders are encouraged to maintain a bearish stance while closely monitoring the invalidation level at 1.06337 for any shifts in market dynamics.
EUR/USD Elliott Wave technical analysis [Video]
Author

Peter Mathers
TradingLounge
Peter Mathers started actively trading in 1982. He began his career at Hoei and Shoin, a Japanese futures trading company.


