EUR/USD Elliott Wave technical analysis [Video]
![EUR/USD Elliott Wave technical analysis [Video]](https://editorial.fxstreet.com/images/Markets/Currencies/Majors/EURUSD/money-euro-and-dollar-banknotes-17371247_XtraLarge.jpg)
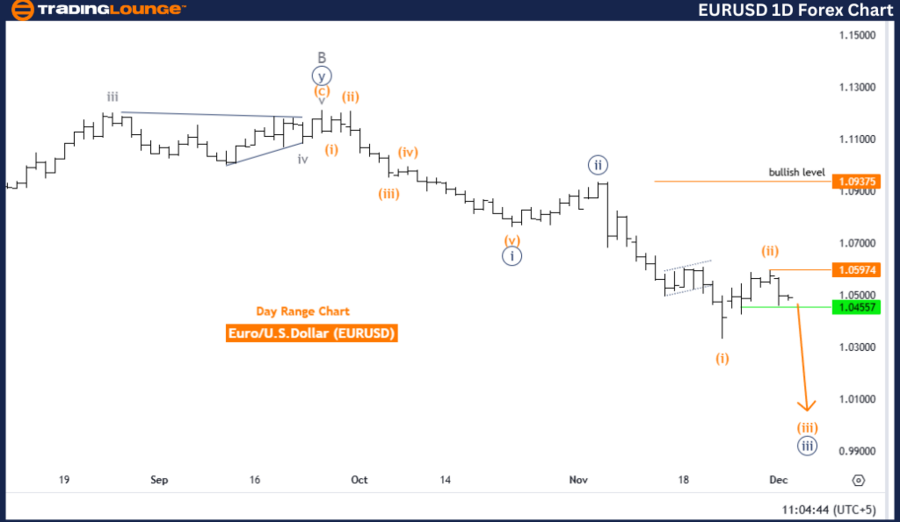
EURUSD Elliott Wave Analysis Trading Lounge.
Euro/U.S. Dollar (EURUSD) Day Chart.
EUR/USD Elliott Wave technical analysis
-
Function: Bearish Trend.
-
Mode: Impulsive.
-
Structure: Orange Wave 3.
-
Position: Navy Blue Wave 3.
-
Direction next Higher Degrees: Orange Wave 4.
Details
The EURUSD daily chart demonstrates an Elliott Wave analysis, identifying a bearish trend in progress. The current wave structure is categorized as orange wave 3, forming part of a broader impulsive pattern within navy blue wave 3.
The analysis indicates that orange wave 2 has likely concluded, paving the way for the continuation of orange wave 3 within the navy blue wave 3 framework. This movement is consistent with Elliott Wave Theory principles, which aim to identify recurring wave patterns for predicting market behaviors.
The current wave sequence suggests persistent bearish momentum. Once orange wave 3 concludes, the next anticipated movement will transition into orange wave 4.
Key levels
-
Wave Cancel Invalidation Level: 1.93575
If the price surpasses this invalidation level, the wave count will need revision, as it would imply a deviation from the expected pattern.
Trading insights
This analysis provides crucial insights into market dynamics, emphasizing the impulsive characteristics of the ongoing wave structure. The bearish outlook suggests a continuation of downward price movement, offering traders a structured framework to anticipate market trends.
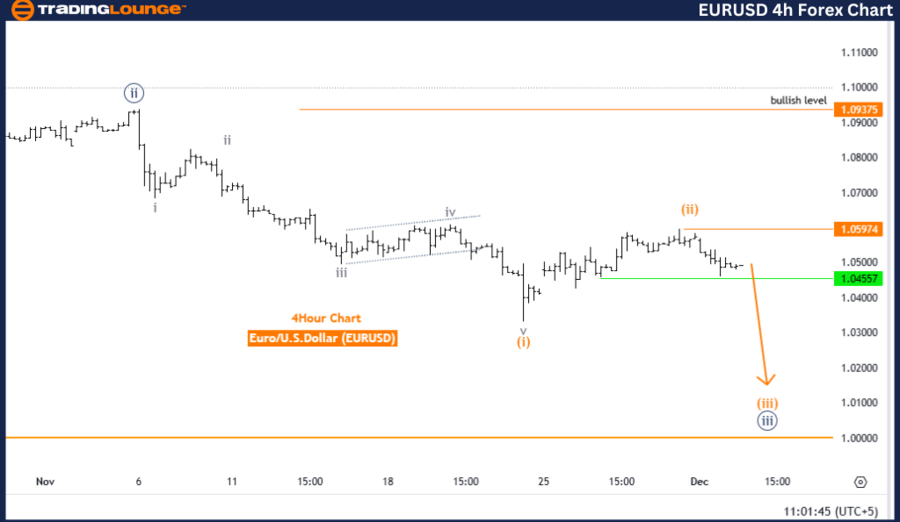
Euro/U.S. Dollar (EURUSD) 4-Hour Chart.
EUR/USD Elliott Wave technical analysis
-
Function: Bearish Trend.
-
Mode: Impulsive.
-
Structure: Orange Wave 3.
-
Position: Navy Blue Wave 3.
-
Direction next higher degrees: Orange Wave 4.
Details
The EURUSD 4-hour chart presents an Elliott Wave analysis suggesting a bearish trend. The current wave structure is classified as orange wave 3, forming a segment of a broader impulsive pattern within navy blue wave 3.
Based on the analysis, orange wave 2 seems to have concluded, allowing the market to progress into orange wave 3 within the framework of navy blue wave 3. This movement aligns with the principles of Elliott Wave Theory, which identifies repetitive wave patterns to forecast market trends.
Orange wave 3 is now actively unfolding. Once completed, the analysis anticipates a shift into orange wave 4 as the next higher-degree direction.
Key levels
-
Wave Cancel Invalidation Level: 1.05974
Any price action surpassing this invalidation level would necessitate revisiting the current wave count, potentially altering the projected trend and structure.
Trading insights
This analysis supports the outlook of continued bearish momentum, emphasizing the impulsive characteristics of the ongoing wave sequence. It offers traders valuable insights into potential market movements while pinpointing critical levels for confirming or invalidating the wave count.
Technical analyst: Malik Awais.
EUR/USD Elliott Wave technical analysis [Video]
Author

Peter Mathers
TradingLounge
Peter Mathers started actively trading in 1982. He began his career at Hoei and Shoin, a Japanese futures trading company.


