EUR/USD Elliott Wave technical analysis [Video]
![EUR/USD Elliott Wave technical analysis [Video]](https://editorial.fxstreet.com/images/Markets/Currencies/Majors/EURUSD/euro-coins-gm520443967-49899402_XtraLarge.jpg)
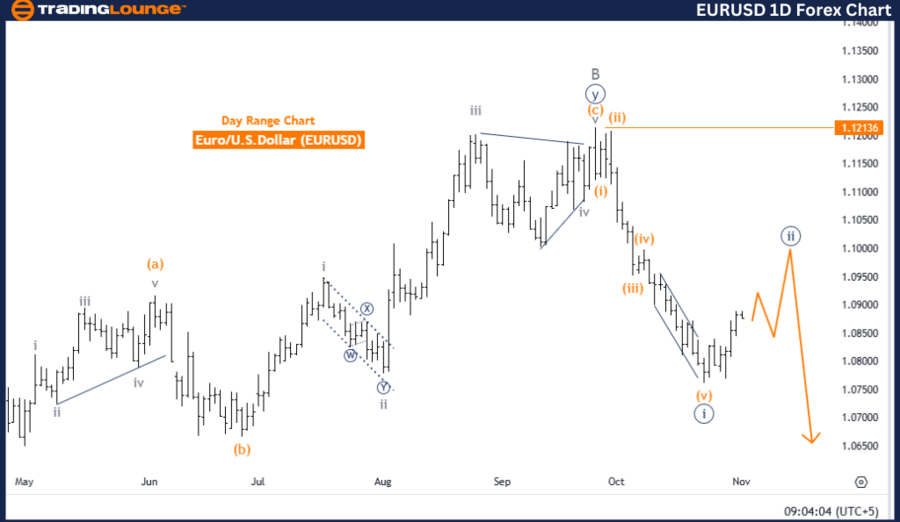
EURUSD Elliott Wave Analysis Trading Lounge.
Euro / U.S. Dollar (EURUSD) Day Chart.
EUR/USD Elliott Wave technical analysis
-
Function: Counter Trend.
-
Mode: Corrective.
-
Structure: Navy Blue Wave 2.
-
Position: Gray wave C.
-
Direction of next lower degrees: Navy blue wave 3.
-
Details: Navy Blue Wave 1 appears completed, with Navy Blue Wave 2 currently active.
-
Wave cancellation level: 1.12136.
The daily Elliott Wave analysis for EURUSD indicates a counter-trend, progressing within a corrective structure. The focus is on navy blue wave 2, following what is likely the completion of navy blue wave 1. This configuration positions the current wave as gray wave C within navy blue wave 2, implying that the corrective wave is unfolding before a possible continuation in the primary trend's direction.
In the context of Elliott Wave theory, wave 2 corrections are typically temporary counter movements to the main trend. Upon completion of wave 2, the forecast anticipates the beginning of navy blue wave 3, which would align with the main trend’s direction. Reaching the conclusion of wave 2 could signal a transition into wave 3, consistent with the broader trend outlined in this analysis.
The wave cancellation threshold at 1.12136 is critical; any movement beyond this point would invalidate the current wave count for navy blue wave 2. If prices surpass this level, a re-evaluation of the wave structure would be necessary, possibly indicating a shift beyond the originally projected corrective phase.
In summary, the EURUSD daily analysis describes a counter-trend corrective structure as navy blue wave 2 unfolds. Following the completion of navy blue wave 1, the current gray wave C within navy blue wave 2 is anticipated to transition into navy blue wave 3, aligning with the primary trend. The critical level of 1.12136 serves as a validation point for this wave count, with movement above it prompting a reassessment. This setup highlights the ongoing corrective phase ahead of a potential return to the main trend in the upcoming waves.
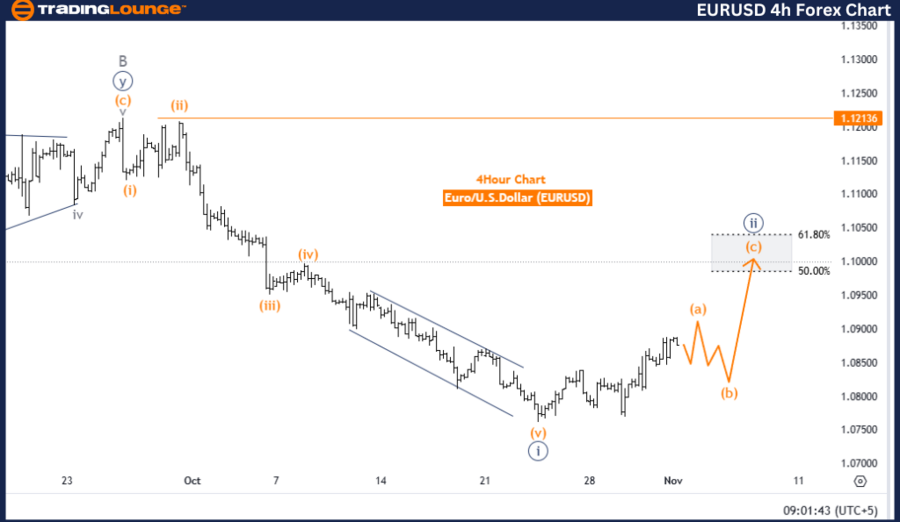
Euro / U.S. Dollar (EURUSD) 4-Hour Chart
EUR/USD Elliott Wave technical analysis
-
Function: Counter Trend.
-
Mode: Corrective.
-
Structure: Navy Blue Wave 2.
-
Position: Gray wave C.
-
Direction of next lower degrees: Navy blue wave 3.
-
Details: Navy Blue Wave 1 appears complete, with Navy Blue Wave 2 now underway.
-
Wave cancellation level: 1.12136.
The 4-hour Elliott Wave analysis of EURUSD shows a counter-trend, currently in a corrective mode. The structure is identified as navy blue wave 2, following the apparent completion of navy blue wave 1. The current position is within gray wave C of navy blue wave 2, indicating a potential consolidation or correction phase within the broader trend before a likely return to the main trend direction in the subsequent wave sequence.
In Elliott Wave analysis, corrective waves such as navy blue wave 2 generally run counter to the main trend. This suggests the market may be preparing for the start of navy blue wave 3, expected to follow once wave 2 completes. The next lower degrees align with navy blue wave 3, supporting a continuation of the primary trend after the corrective phase concludes.
A critical element in this analysis is the wave cancellation level at 1.12136. Should prices exceed this level, the current interpretation of navy blue wave 2 would be invalidated, prompting a possible reevaluation of the wave count and indicating a shift in the anticipated price trend.
In summary, the EURUSD 4-hour analysis illustrates a counter-trend corrective structure within navy blue wave 2, signaling a temporary pullback. The expected completion of navy blue wave 2 could lead into navy blue wave 3, resuming the main trend. The wave cancellation level of 1.12136 is essential for validating this outlook, with movement beyond it suggesting a potential adjustment to the projected wave pattern. This setup reflects a corrective phase before the market is expected to realign with the primary trend in the following waves.
Technical analyst: Malik Awais.
EUR/USD Elliott Wave technical analysis [Video]
Author

Peter Mathers
TradingLounge
Peter Mathers started actively trading in 1982. He began his career at Hoei and Shoin, a Japanese futures trading company.


