EUR/USD Elliott Wave technical analysis [Video]
![EUR/USD Elliott Wave technical analysis [Video]](https://editorial.fxstreet.com/images/Markets/Currencies/Majors/EURUSD/MoneyEURUSD_3_XtraLarge.jpg)
EUR/USD Elliott Wave analysis
Function: Counter Trend.
Mode: Corrective.
Wave structure: Navy Blue Wave 2.
Position: Gray Wave C.
Next lower degree direction: Navy Blue Wave 3.
Details: Navy blue wave 1 appears completed; navy blue wave 2 is now active.
Wave cancel level: 1.12136.
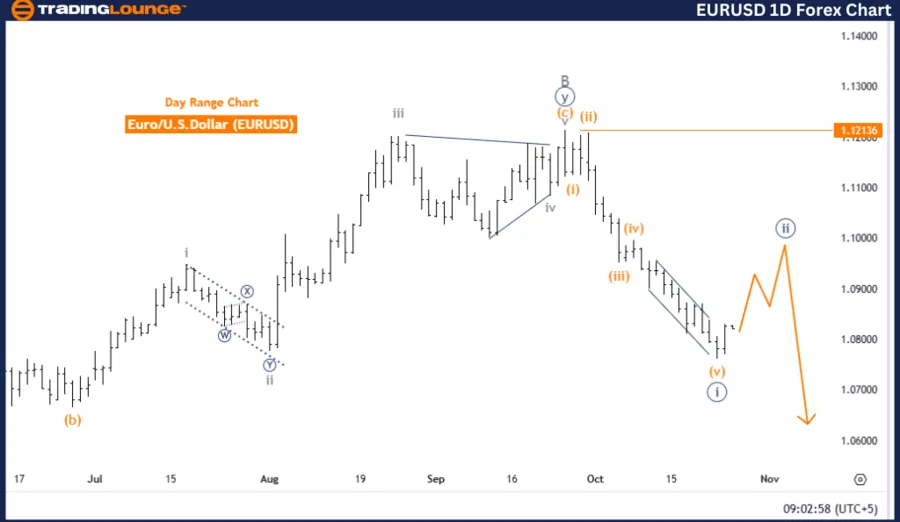
EUR/USD day chart analysis summary
The EURUSD Day Chart’s Elliott Wave analysis identifies the current trend as counter-trend, within a corrective structure. The focus remains on navy blue wave 2, following the completion of navy blue wave 1, indicating the market is presently in a retracement phase, moving briefly in opposition to the primary trend direction.
Currently, the wave structure places the EURUSD within gray wave C, part of the corrective movement of navy blue wave 2. This phase indicates the market may be close to ending its retracement, after which navy blue wave 3 is expected to begin, signaling a potential resumption of the main trend direction based on prevailing market conditions.
The conclusion of navy blue wave 1 highlights that an impulsive move has taken place, and the market is now in a pullback phase, marked by the ongoing development of navy blue wave 2. According to Elliott Wave theory, markets alternate between impulsive and corrective phases, where wave 2 functions as a corrective sequence following an initial impulsive wave.
The wave cancellation level for the current structure is set at 1.12136. If prices fall below this level, the current wave count will be invalidated, necessitating a revised market structure analysis.
Summary of EUR/USD day chart outlook
In summary, the EURUSD Day Chart remains in a corrective mode with navy blue wave 2 underway. Upon the completion of gray wave C, the market may transition to navy blue wave 3, marking a potential return to the primary trend. This wave structure is valid unless the price breaches 1.12136, which would nullify the current analysis.
EUR/USD Elliott Wave technical analysis
Function: Counter Trend.
Mode: Corrective.
Wave Structure: Navy Blue Wave 2.
Position: Gray Wave C.
Next lower degree direction: Navy Blue Wave 3.
Details: Navy blue wave 1 appears completed; navy blue wave 2 is now active.
Wave cancel level: 1.12136.
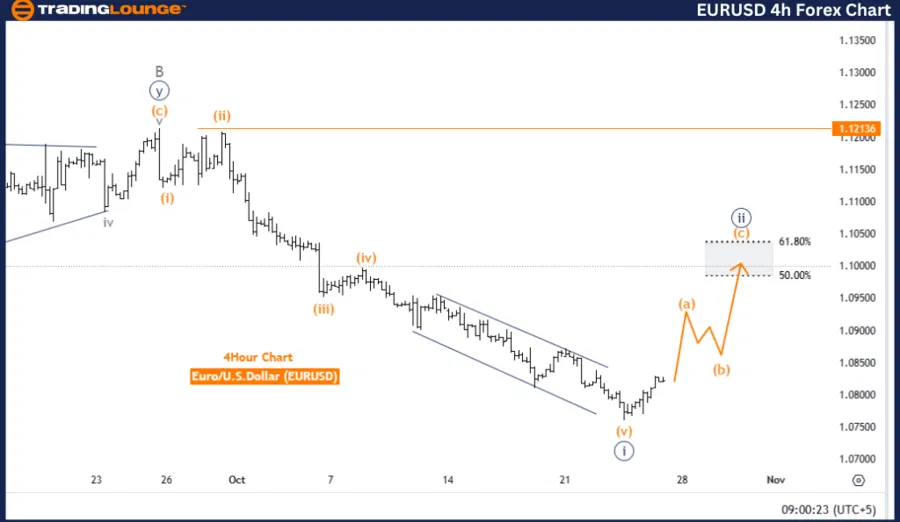
EUR/USD four-hour chart analysis summary
The EURUSD 4-hour chart’s Elliott Wave analysis indicates a counter-trend scenario, characterized by a corrective structure. The main wave under analysis is navy blue wave 2, which has commenced following the end of navy blue wave 1. The corrective mode implies a temporary reversal against the primary trend, indicating a pullback within the broader market movement.
Currently, the EURUSD is positioned within gray wave C, the final phase of navy blue wave 2, suggesting that the correction is near completion. Following gray wave C, the analysis anticipates the start of navy blue wave 3, which would mark a potential return to the impulsive direction once the correction ends.
The conclusion of navy blue wave 1 signifies that a major impulsive movement has occurred, and the market is now retracing in navy blue wave 2, a typical pullback phase in Elliott Wave theory. This phase serves as a pause before the main trend resumes, either upward or downward, depending on the development of wave 3.
The wave cancellation level is set at 1.12136. If the price dips below this threshold, it would invalidate the current wave count, indicating a possible shift in wave structure and necessitating a reevaluation of the market’s direction.
Summary of EUR/USD four-hour chart outlook
In summary, the EURUSD 4-hour chart remains in a corrective mode with navy blue wave 2 underway. Upon the completion of gray wave C, the onset of navy blue wave 3 is expected, signaling a potential continuation of the primary trend. The current wave structure remains valid unless the price drops below 1.12136, which would invalidate this analysis.
EUR/USD Elliott Wave technical analysis [Video]
Author

Peter Mathers
TradingLounge
Peter Mathers started actively trading in 1982. He began his career at Hoei and Shoin, a Japanese futures trading company.


