EUR/USD Elliott Wave technical analysis [Video]
![EUR/USD Elliott Wave technical analysis [Video]](https://editorial.fxstreet.com/images/Markets/Currencies/Majors/EURUSD/world-currencies-53475296_XtraLarge.jpg)
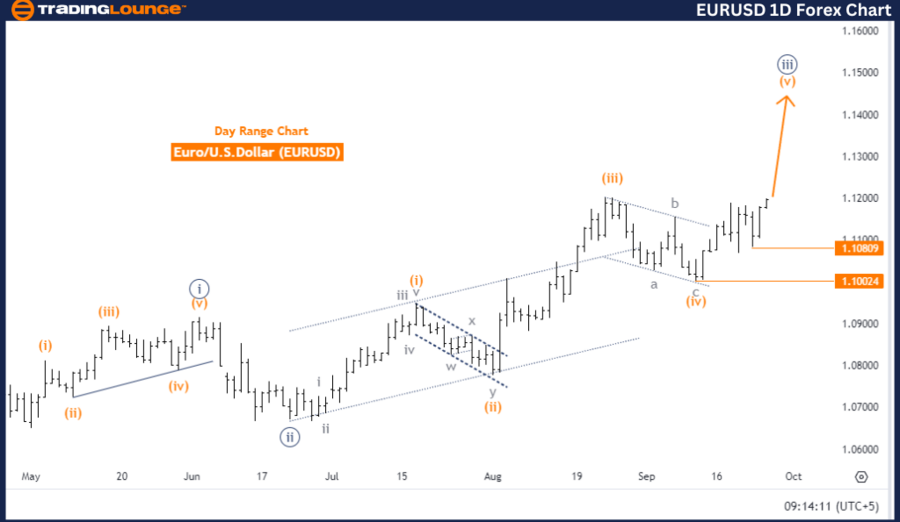
EUR/USD Elliott Wave Analysis Trading Lounge Day Chart.
EUR/USD Elliott Wave technical analysis
Function: Bullish Trend.
Mode: Impulsive.
Structure: Orange wave 5.
Position: Navy blue wave 3.
Next lower degree direction: Navy blue wave 4.
Details: Orange wave 4 appears to be completed, and now orange wave 5 is in progress.
Wave cancellation invalid level: 1.10809.
The EURUSD Elliott Wave analysis on the daily chart indicates a bullish trend, following an impulsive wave mode. The wave structure is currently identified as orange wave 5, which is positioned within navy blue wave 3. This setup suggests that the market is experiencing the third wave of a higher degree sequence, often signifying strong upward momentum.
Before this phase, orange wave 4 seems to have concluded, marking the end of a corrective phase. With the completion of orange wave 4, orange wave 5 has now started, indicating the final stage of the impulsive wave sequence. This wave typically continues the prevailing trend but may slow down as the market approaches a potential peak. The analysis also points out a critical invalidation level at 1.10809, which serves as a key point for assessing the current wave count. Should the price reach this level, it would invalidate the existing wave pattern, potentially signaling a shift in market direction.
Summary
The EURUSD is currently trending upwards, driven by orange wave 5 within the broader context of navy blue wave 3. The completion of orange wave 4 suggests a continuation of the bullish trend. However, traders should exercise caution around the invalidation level of 1.10809, as a breach of this point could challenge the current wave structure.
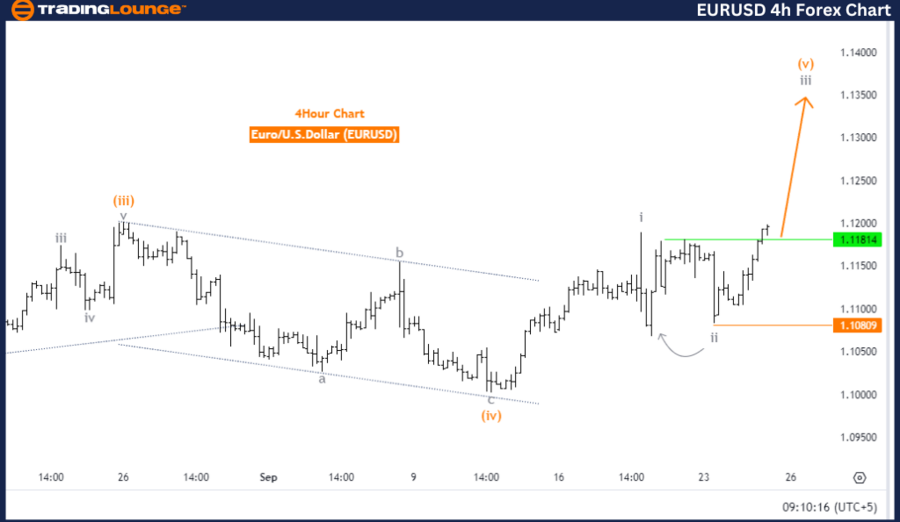
Euro/ U.S. Dollar (EUR/USD) four-hour chart.
EUR/USD Elliott Wave technical analysis
Function: Bullish Trend.
Mode: Impulsive.
Structure: Gray wave 3.
Position: Orange wave 5.
Next lower degree direction: Gray wave 4.
Details: Gray wave 2 appears to be completed, and gray wave 3 is currently in progress.
Wave cancellation invalid level: 1.10809.
The EURUSD Elliott Wave analysis on the 4-hour chart indicates a strong bullish trend with an impulsive wave structure. The current wave formation is identified as gray wave 3, which is unfolding, while the position is described as orange wave 5. This implies that the market is currently in the fifth and final sub-wave of gray wave 3.
Earlier, gray wave 2, which was a corrective phase, seems to have been completed. With the conclusion of gray wave 2, gray wave 3 has taken over, continuing the bullish trend. In Elliott Wave theory, wave 3 often demonstrates significant upward momentum and is frequently the longest and most dynamic wave in the sequence.
The analysis points out that the next likely development is the formation of gray wave 4. After the completion of gray wave 3, which includes orange wave 5, the market could enter a corrective phase before the upward trend resumes in gray wave 5.
As long as the price remains above the invalidation level of 1.10809, the current wave structure holds. If the price drops below this point, the wave count would be invalidated, signaling a potential shift in market dynamics or a trend reversal.
Conclusion
The EURUSD 4-hour chart reveals a robust bullish trend, with gray wave 3 in progress following the completion of gray wave 2. As long as the price stays above 1.10809, the bullish trend is expected to persist, possibly followed by a short correction in gray wave 4 before further upward movement continues.
EUR/USD Elliott Wave technical analysis [Video]
Author

Peter Mathers
TradingLounge
Peter Mathers started actively trading in 1982. He began his career at Hoei and Shoin, a Japanese futures trading company.


