EUR/USD Elliott Wave technical analysis [Video]
![EUR/USD Elliott Wave technical analysis [Video]](https://editorial.fxstreet.com/images/Markets/Currencies/Majors/EURUSD/money-9377516_XtraLarge.jpg)
EUR/USD Elliott Wave technical analysis
-
Function: Bullish Trend.
-
Mode: Impulsive.
-
Structure: Orange wave 3.
-
Position: Navy blue wave 3.
-
Direction next lower degrees: Orange wave 4.
-
Details: Orange wave 2 appears complete; now, orange wave 3 is underway.
-
Wave cancel invalidation level: 1.10092.
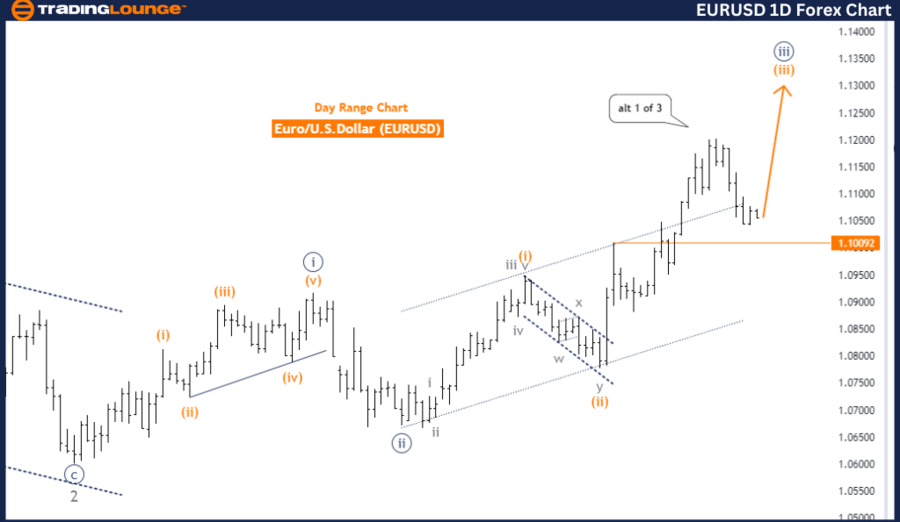
The EURUSD daily chart, analyzed using Elliott Wave principles, indicates a strong bullish trend currently in progress. The chart is in an impulsive mode, with orange wave 3 developing within the broader structure of navy blue wave 3. This suggests the market is experiencing significant upward momentum as it advances within this impulsive phase.
The analysis reveals that orange wave 2 seems to have completed, marking the conclusion of a corrective phase. Subsequently, orange wave 3 has commenced, indicating a continuation of the upward trend. This wave is expected to drive the market higher as it progresses through its various stages.
As orange wave 3 unfolds, the next anticipated move in the Elliott Wave sequence is the formation of orange wave 4. Typically, wave 4 represents a corrective phase following the impulsive wave 3, potentially offering a retracement or consolidation before the market resumes its upward momentum. However, the current focus remains on the development of orange wave 3, which signals that the bullish trend is likely to persist for now.
The wave cancel invalidation level is set at 1.10092, meaning that if the price drops below this level, the current wave count would be invalidated, suggesting a possible shift in market direction. However, as long as the price remains above this critical level, the bullish outlook remains intact.
In summary, the EURUSD daily chart reflects a robust bullish trend, with orange wave 3 currently in play following the completion of orange wave 2. The market is expected to continue its upward trajectory as orange wave 3 unfolds, with a potential corrective phase in orange wave 4 on the horizon. The bullish trend remains as long as the price stays above the wave cancel invalidation level of 1.10092.
EUR/USD day chart
EUR/USD Elliott Wave technical analysis
-
Function: Bullish Trend.
-
Mode: Impulsive.
-
Structure: Gray wave 5.
-
Position: Orange wave 3.
-
Direction next lower degrees: Orange wave 4.
-
Details: Gray wave 4 appears complete; now gray wave 5 is underway.
-
Wave cancel invalidation level: 1.10092.
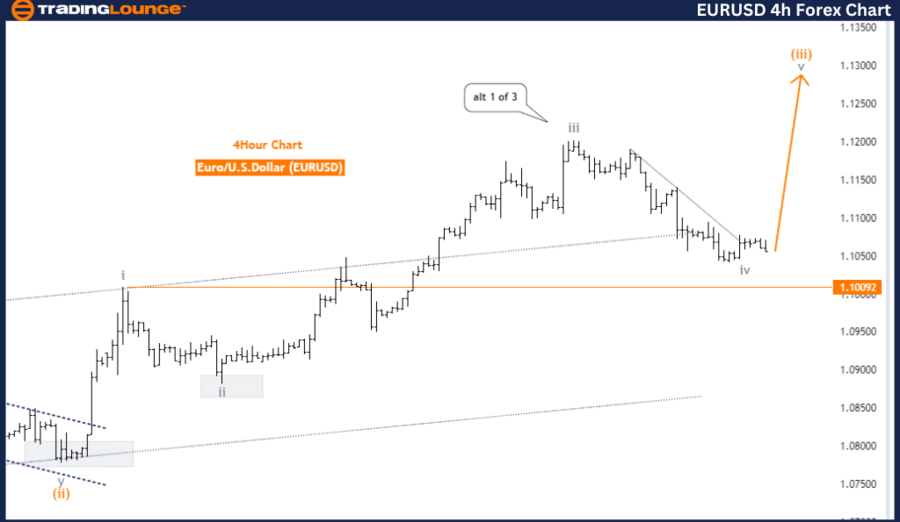
The EURUSD 4-hour chart, analyzed using Elliott Wave principles, indicates a bullish trend currently in progress. The market is in an impulsive mode, with the focus on the development of gray wave 5. This wave follows the completion of gray wave 4, marking the end of a corrective phase. With gray wave 4 complete, the market has transitioned into gray wave 5, signaling the continuation of the upward trend.
The chart shows that gray wave 5 is actively unfolding, driven by the preceding orange wave 3. This phase suggests a strong upward movement within the overall bullish structure. The market is expected to maintain this upward momentum as long as the price action remains above the wave cancel invalidation level, set at 1.10092. If the price drops below this level, it would invalidate the current wave count, indicating a possible shift in the market's direction.
As gray wave 5 progresses, the next step in the Elliott Wave sequence is the formation of orange wave 4. This wave typically represents a corrective phase following the completion of orange wave 3. However, the primary focus remains on the current development of gray wave 5, which is expected to continue pushing the market higher.
In summary, the EURUSD 4-hour chart reflects a strong bullish trend, with gray wave 5 currently in play after the completion of gray wave 4. The analysis suggests that the market will likely continue its upward movement unless the price falls below the critical wave cancel invalidation level of 1.10092. This indicates that the market is in a healthy uptrend, with further potential gains expected as gray wave 5 unfolds.
EUR/USD four-hour chart
EUR/USD Elliott Wave technical analysis [Video]
Author

Peter Mathers
TradingLounge
Peter Mathers started actively trading in 1982. He began his career at Hoei and Shoin, a Japanese futures trading company.


