EUR/USD Elliott Wave technical analysis [Video]
![EUR/USD Elliott Wave technical analysis [Video]](https://editorial.fxstreet.com/images/Markets/Currencies/Majors/EURUSD/dollar-and-euro-bills-58059534_XtraLarge.jpg)
EUR/USD Elliott Wave technical analysis
-
Function: Trend.
-
Mode: Impulsive.
-
Structure: Orange wave 3.
-
Position: Navy blue wave 3.
-
Direction next lower degrees: Orange wave 4.
-
Details: Orange wave 2 appears complete, and orange wave 3 is currently in progress.
-
Wave cancel invalid level: 1.07780.
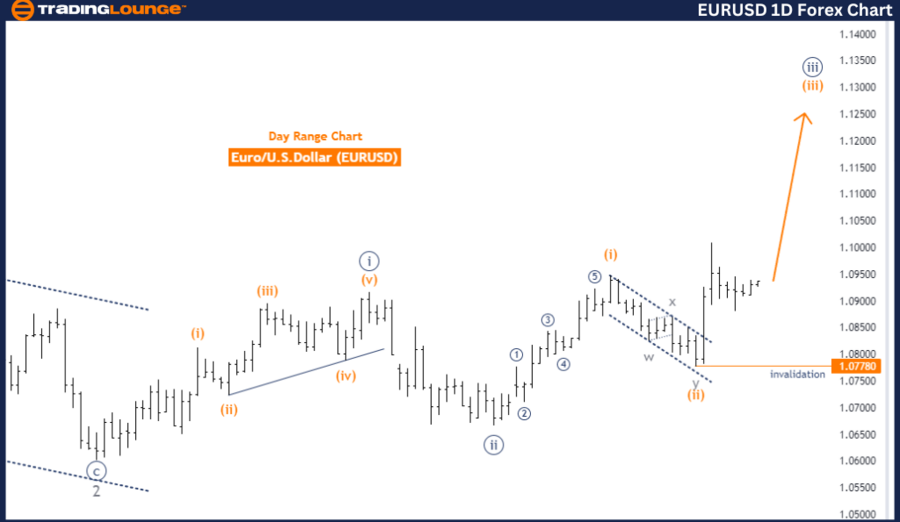
The EURUSD Elliott Wave Analysis on the daily chart indicates that the market is currently in a trend mode, defined by an impulsive structure. This analysis centers on the development of orange wave 3, which forms part of a larger navy blue wave 3, suggesting strong upward momentum in the market.
Before the current phase, orange wave 2, a corrective wave, seems to have concluded. Following this, orange wave 3 has initiated and is now actively unfolding. The shift from the corrective phase of wave 2 to the impulsive nature of wave 3 signals a continuation of the overall upward trend. The progression within orange wave 3 indicates ongoing bullish activity in the market.
As the market progresses through orange wave 3, the next expected phase is orange wave 4, a lower-degree wave likely to introduce a corrective movement. However, the focus at present remains on the upward trajectory of orange wave 3, which is anticipated to continue driving the market higher.
A critical level to monitor in this analysis is the wave cancel invalid level, set at 1.07780. This level serves as a threshold for the validity of the current Elliott Wave count. Should the market decline below this level, the current wave analysis would be invalidated, suggesting that the anticipated upward movement within orange wave 3 might not proceed as expected. This invalidation point is essential for traders to watch, as it could signal a potential change in market direction.
In summary, the EURUSD Elliott Wave Analysis on the daily chart highlights an ongoing impulsive upward trend within orange wave 3, following the completion of orange wave 2. The market is currently focused on this upward phase, with the invalidation level at 1.07780 acting as a key point to determine the continued validity of this wave structure.
EUR/USD one-day chart
EURUSD Elliott Wave technical analysis
-
Function: Trend.
-
Mode: Impulsive.
-
Structure: Gray wave 3.
-
Position: Orange wave 3.
-
Direction next lower degrees: Gray wave 4.
-
Details: Gray wave 2 appears complete, and gray wave 3 is currently in progress.
-
Wave cancel invalid level: 1.07780.
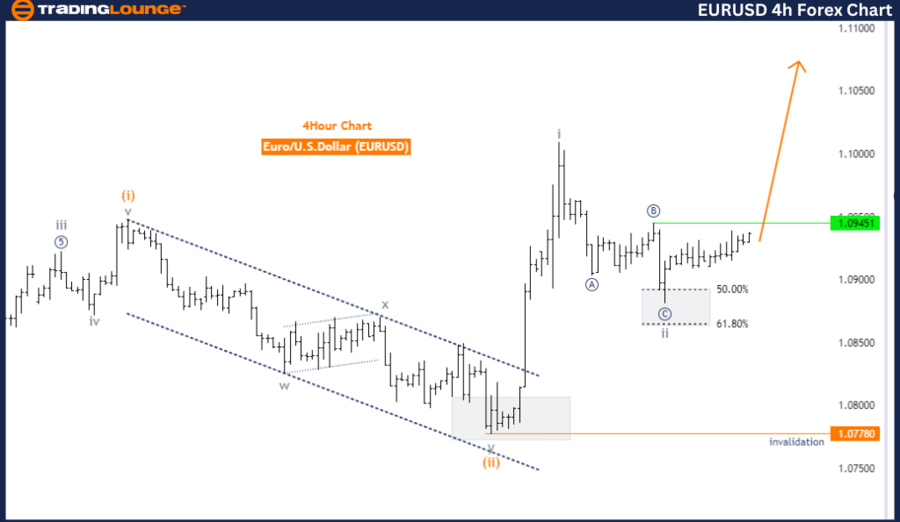
The EURUSD Elliott Wave Analysis on the 4-hour chart shows that the market is currently in a trend mode, characterized by an impulsive structure. This analysis focuses on gray wave 3, representing the ongoing upward movement in the market. Gray wave 3 is part of a broader impulsive wave sequence, indicating strong upward momentum.
According to the analysis, gray wave 2, the preceding corrective wave, seems to have completed. The end of gray wave 2 marks the conclusion of the corrective phase and the beginning of gray wave 3, where the market is expected to continue moving upward with increased strength. The current focus is on the progression of gray wave 3, which is actively unfolding.
The next lower degrees' direction is identified as gray wave 4, suggesting that after gray wave 3 reaches its peak, the market might enter another corrective phase before potentially resuming the upward trend. For now, gray wave 3 remains the dominant wave within the current market structure, driving the trend.
The wave cancel invalid level is set at 1.07780, serving as a crucial threshold for the validity of the current Elliott Wave count. Should the market drop below this level, it would invalidate the current wave analysis, indicating that the anticipated continuation of the upward movement within gray wave 3 might not occur as predicted. In such a scenario, the wave structure and overall market outlook would require reassessment.
In summary, the EURUSD Elliott Wave Analysis on the 4-hour chart highlights the ongoing upward trend within gray wave 3, following the completion of gray wave 2. The analysis underscores the continuation of this trend, with a key invalidation level at 1.07780. The market is expected to remain in an upward phase as gray wave 3 continues to unfold.
EUR/USD four-hour chart
EUR/USD Elliott Wave technical analysis [Video]
Author

Peter Mathers
TradingLounge
Peter Mathers started actively trading in 1982. He began his career at Hoei and Shoin, a Japanese futures trading company.


