EUR/USD Elliott Wave technical analysis [Video]
![EUR/USD Elliott Wave technical analysis [Video]](https://editorial.fxstreet.com/images/Markets/Currencies/Majors/EURUSD/world-currencies-53600634_XtraLarge.jpg)
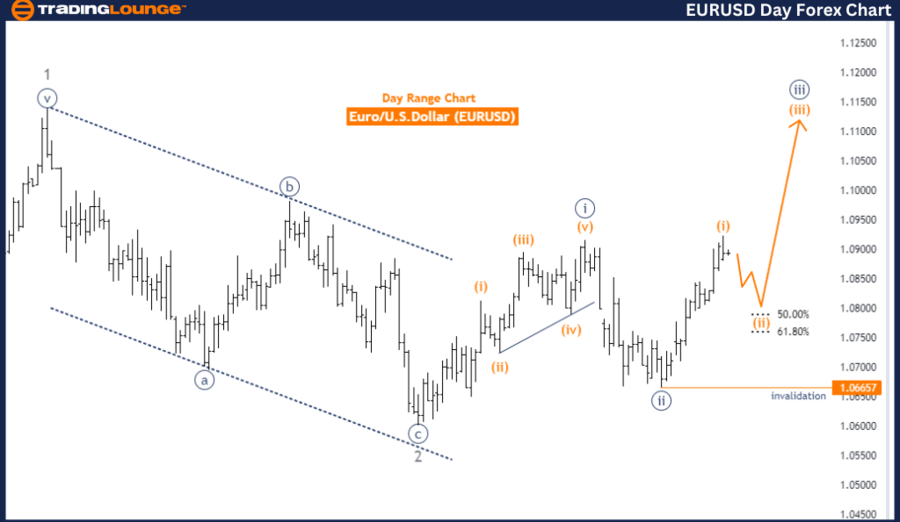
EURUSD Day Chart Analysis.
EURUSD Elliott Wave Analysis - Trading Lounge Day Chart.
Euro/U.S. Dollar (EURUSD) Day Chart.
EURUSD Elliott Wave technical analysis
-
Function: Counter Trend.
-
Mode: Corrective.
-
Structure: Orange Wave 2.
-
Position: Navy Blue Wave 3.
-
Direction next higher degrees: Orange Wave 3.
Details:
-
Current status: Orange Wave 1 appears complete.
-
Current phase: Orange Wave 2 is active.
-
Wave cancel invalid level: 1.06657
The EURUSD Elliott Wave analysis for the day chart examines the current market behavior and wave structure. The analysis indicates a counter-trend phase, suggesting a corrective movement within the broader trend.
The specific wave structure under review is Orange Wave 2, which is part of Navy Blue Wave 3. This implies the market is in a corrective phase within a larger impulsive wave. The completion of Orange Wave 1 marks the end of an initial impulsive move within Navy Blue Wave 3. Now, the market is experiencing Orange Wave 2, a corrective wave that typically retraces some of the gains from the impulsive Wave 1.
The next higher degree direction is identified as Orange Wave 3. This suggests that after the completion of Orange Wave 2, the market is expected to resume its impulsive trend with the start of Orange Wave 3. This phase will follow the corrective action of Orange Wave 2 and continue the primary trend.
A critical element of this analysis is the wave cancel invalid level, set at 1.06657. This level is essential for traders as it serves as a benchmark to determine the validity of the current wave count. If the market price exceeds this level, the current wave count would be invalidated, necessitating a reassessment of the market conditions and potential repositioning. This invalidation point is crucial for risk management, providing a clear point at which traders should reconsider their analysis and strategies.
Summary:
-
The EURUSD day chart analysis identifies a corrective trend characterized by Orange Wave 2 within Navy Blue Wave 3.
-
Orange Wave 1 is completed, and the market is now in the corrective phase of Orange Wave 2.
-
The expected next phase is Orange Wave 3, following the completion of Orange Wave 2.
-
The wave cancel invalid level at 1.06657 is critical for maintaining the current wave count's validity and for effective risk management.
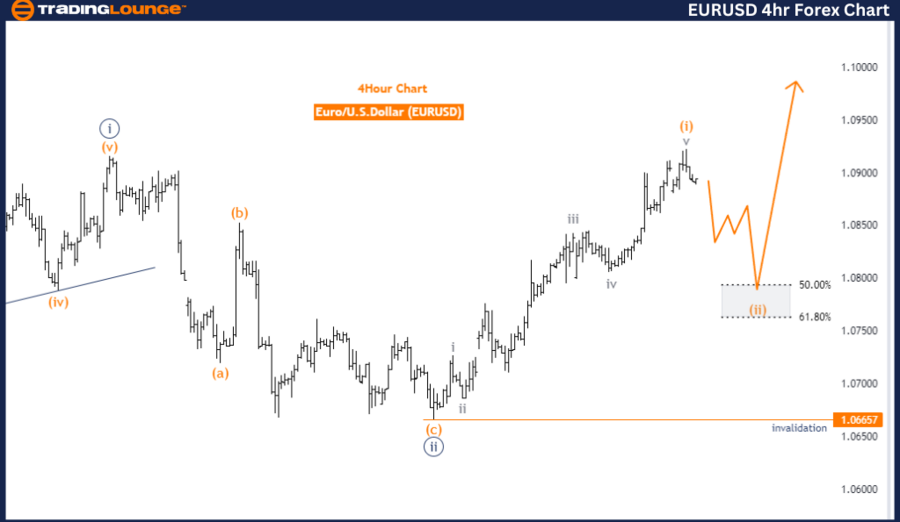
EURUSD 4-Hour Chart Analysis.
EURUSD Elliott Wave Analysis - Trading Lounge 4-Hour Chart.
Euro/U.S. Dollar (EURUSD) 4-Hour Chart.
EUR/USD Elliott Wave technical analysis
-
Function: Counter Trend.
-
Mode: Corrective.
-
Structure: Orange Wave 2.
-
Position: Navy Blue Wave 3.
-
Direction next higher degrees: Orange Wave 3.
Details:
-
Current status: Orange Wave 1 appears complete.
-
Current phase: Orange Wave 2 is active.
-
Wave cancel invalid level: 1.06657
The EURUSD Elliott Wave analysis for the 4-hour chart examines the current market trends and wave patterns. The analysis identifies the market's movement as a counter-trend, indicating a corrective phase rather than an impulsive one.
The specific wave structure under review is Orange Wave 2, which is part of a larger Navy Blue Wave 3. This suggests that the market is undergoing a correction within a broader upward trend. According to the analysis, Orange Wave 1 has completed, signaling the end of the initial impulsive move within Navy Blue Wave 3. Subsequently, the market has entered Orange Wave 2, which is a corrective phase that typically retraces some of the movement made during Orange Wave 1.
The next anticipated direction in this analysis is Orange Wave 3. Once Orange Wave 2 concludes, the market is expected to resume its impulsive movement with the start of Orange Wave 3, continuing the overall trend set by Navy Blue Wave 3.
An essential aspect of this analysis is the wave cancellation invalid level, set at 1.06657. This level serves as a critical reference point for traders, as it determines the validity of the current wave count. If the market price moves beyond this level, the existing wave analysis would be invalidated, requiring a reassessment of the market's condition and potential strategic adjustments. This invalidation level is vital for risk management, providing traders with a clear threshold to monitor.
Summary:
-
The EURUSD 4-hour chart analysis identifies a counter-trend characterized by Orange Wave 2 within Navy Blue Wave 3.
-
Orange Wave 1 has been completed, and the market is now experiencing Orange Wave 2.
-
The next phase expected is Orange Wave 3, following the completion of Orange Wave 2.
-
The wave cancellation invalid level at 1.06657 is crucial for maintaining the accuracy of the current wave count and for effective risk management.
Technical analyst: Malik Awais.
EUR/USD Elliott Wave technical analysis [Video]
Author

Peter Mathers
TradingLounge
Peter Mathers started actively trading in 1982. He began his career at Hoei and Shoin, a Japanese futures trading company.


