EUR/USD Elliott Wave technical analysis [Video]
![EUR/USD Elliott Wave technical analysis [Video]](https://editorial.fxstreet.com/images/Markets/Currencies/Majors/EURUSD/money-9377516_XtraLarge.jpg)
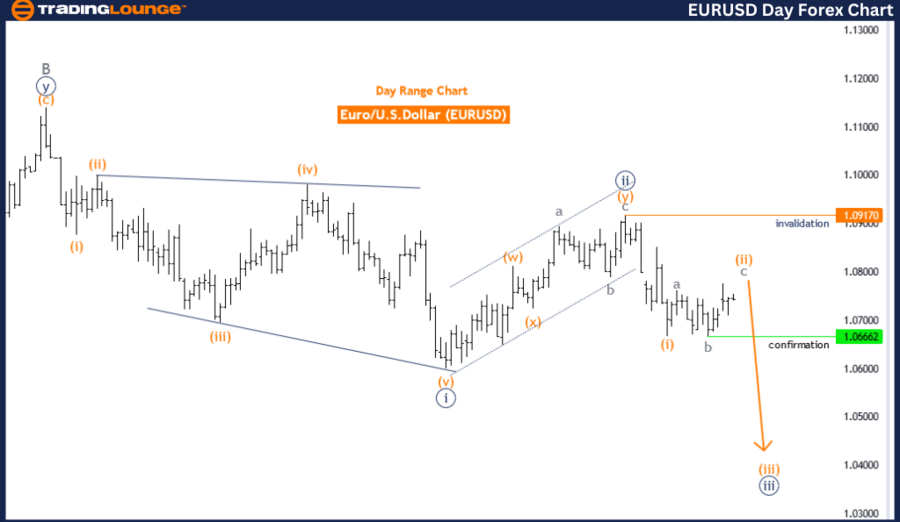
EURUSD Elliott Wave Analysis - Daily Chart.
EUR/USD Elliott Wave technical analysis
Trend function: Trend.
Mode: Corrective.
Structure: Orange Wave 2.
Position: Navy Blue Wave 3.
Direction for next lower degrees: Orange Wave 3.
Details: Orange Wave 1 is completed at 1.06672, now Orange Wave 2 is near its end. Wave Cancel Invalid Level: 1.09170.
The EURUSD Elliott Wave analysis on the daily chart indicates that the trend function is currently in a corrective mode. This suggests a temporary market reversal or consolidation instead of a continuation of the primary direction.
Wave structure
-
Orange Wave 2: Follows the completion of Orange Wave 1.
-
Navy Blue Wave 3 Position: Indicates the market's preparation to transition into the third wave of a larger navy blue wave sequence.
Key points
-
Wave 2 is generally a retracement phase, correcting the initial impulse wave (Wave 1) before continuing the primary trend.
-
Wave 3 is often the most dynamic and extended wave, characterized by significant movement in the direction of the trend.
Next direction
-
Orange Wave 3: Once Orange Wave 2 is complete, the market is expected to begin a strong upward movement as part of Orange Wave 3. This wave is typically the most powerful, indicating a continuation of the primary trend.
Analysis details
-
Orange Wave 1 is considered complete at 1.06672.
-
Orange Wave 2 is in play and nearing its end, signaling the end of the corrective phase and the start of Orange Wave 3.
-
Wave Cancel Invalid Level: Set at 1.09170. If the market exceeds this level, the current wave count will be invalidated, requiring a reassessment of the wave structure.
Summary
The EURUSD on the daily chart is in a corrective phase within Orange Wave 2, which is nearing completion. The market is expected to start Orange Wave 3, indicating a strong upward movement. The wave cancel invalid level is 1.09170, beyond which the current analysis would need to be reconsidered.
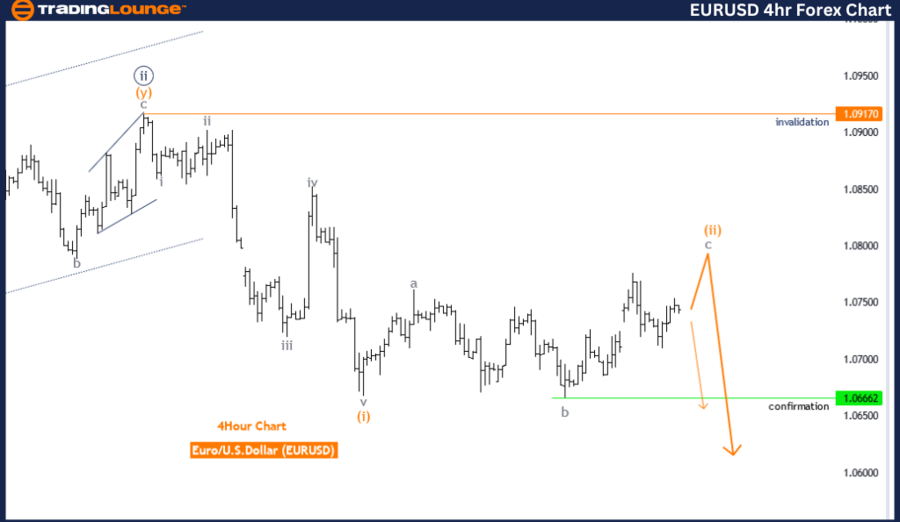
EURUSD Elliott Wave Analysis - 4-Hour Chart.
EUR/USD Elliott Wave technical analysis
Trend function: Trend.
Mode: Corrective.
Structure: Orange Wave 2.
Position: Navy Blue Wave 3.
Direction for next lower degrees: Orange Wave 3.
Details: Orange Wave 1 completed at 1.06672. Orange Wave 2 is in play and nearing its end. Wave Cancel Invalid Level: 1.09170.
The EURUSD Elliott Wave analysis on the 4-hour chart suggests that the market is currently in a trend function. This trend is in a corrective mode, indicating a temporary reversal or consolidation rather than a continuation of the primary trend.
Wave structure
-
Orange Wave 2: Part of the corrective phase following the completion of Orange Wave 1.
-
Navy Blue Wave 3 Position: The market is expected to transition into the third wave of a larger navy blue wave sequence.
Key points
-
Wave 2 is typically a retracement phase, correcting the initial impulse wave (Wave 1) and setting the stage for Wave 3.
-
Wave 3 is usually the most dynamic and extended wave, characterized by significant movement in the trend’s direction.
Next direction
-
Orange Wave 3: After the completion of Orange Wave 2, the market is anticipated to begin a strong upward movement as part of Orange Wave 3. This wave is generally the most powerful in the Elliott Wave cycle.
Analysis details
-
Orange Wave 1 completed at 1.06672.
-
Orange Wave 2 is in play and nearing its end, signaling the conclusion of the corrective phase and the onset of Orange Wave 3.
-
Wave Cancel Invalid Level: Set at 1.09170. If the market exceeds this level, the current wave count will be invalidated, requiring a reevaluation of the wave structure.
Summary
The EURUSD on the 4-hour chart is currently in a corrective phase within Orange Wave 2. This wave is nearing completion, and the market is expected to start Orange Wave 3, indicating a strong upward movement. The wave cancel invalid level is 1.09170, beyond which the current analysis would need to be reassessed.
Technical analyst: Malik Awais
EUR/USD Elliott Wave technical analysis [Video]
Author

Peter Mathers
TradingLounge
Peter Mathers started actively trading in 1982. He began his career at Hoei and Shoin, a Japanese futures trading company.


