EUR/USD Elliott Wave technical analysis [Video]
![EUR/USD Elliott Wave technical analysis [Video]](https://editorial.fxstreet.com/images/Markets/Currencies/Majors/EURUSD/euro-coins-gm520443967-49899402_XtraLarge.jpg)
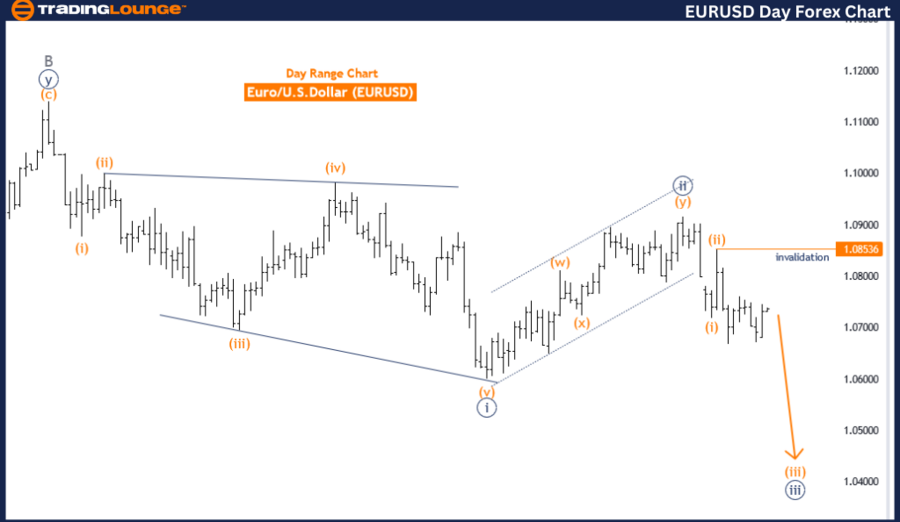
EURUSD Elliott Wave Analysis Trading Lounge Day Chart
Euro/U.S Dollar (EURUSD) Day Chart
EUR/USD Elliott Wave technical analysis
Function: Trend.
Mode: Impulsive.
Structure: Orange wave 3.
Position: Navy Blue Wave 3.
Next lower degree direction: Orange wave 3 (continue).
Details:
Orange wave 2 appears complete at 1.08536. Now, orange wave 3 of 3 is in play. Wave cancellation invalid level: 1.08536.
The EURUSD Elliott Wave analysis on the daily chart provides a detailed examination of the current market trend and projected movements based on Elliott Wave theory. This analysis identifies and interprets the prevailing market trend as impulsive, indicating strong and directional movement aligned with the primary trend.
The market structure is categorized as orange wave 3 within this analysis. This wave is part of a larger sequence, crucial for understanding the market’s progression. The current position is navy blue wave 3, suggesting the market is in the third wave of the larger orange wave 3 sequence. This indicates a continuation of the strong upward or downward movement characteristic of wave 3 in Elliott Wave theory.
The direction for the next lower degrees focuses on the continuation of orange wave 3. This implies that the market is expected to maintain its impulsive movement within this wave, potentially leading to significant price shifts as the wave develops further.
Detailed observations highlight that orange wave 2 has been completed at 1.08536. With the completion of orange wave 2, the market has transitioned into orange wave 3 of 3. This phase is significant as wave 3 of 3 is typically marked by strong and rapid price movements, aligning with the impulsive nature of the trend.
A crucial aspect of this analysis is the wave cancellation invalid level, also set at 1.08536. This level acts as a key threshold for validating the current wave count. If the market price moves beyond this level, it would invalidate the existing wave structure, necessitating a reassessment of the Elliott Wave count and potentially altering the market outlook.
Summary:
-
Trend: Impulsive within orange wave 3.
-
Position: Navy blue wave 3.
-
Next Move: Continuation of orange wave 3 of 3.
-
Key Level: 1.08536 to validate the current wave count.
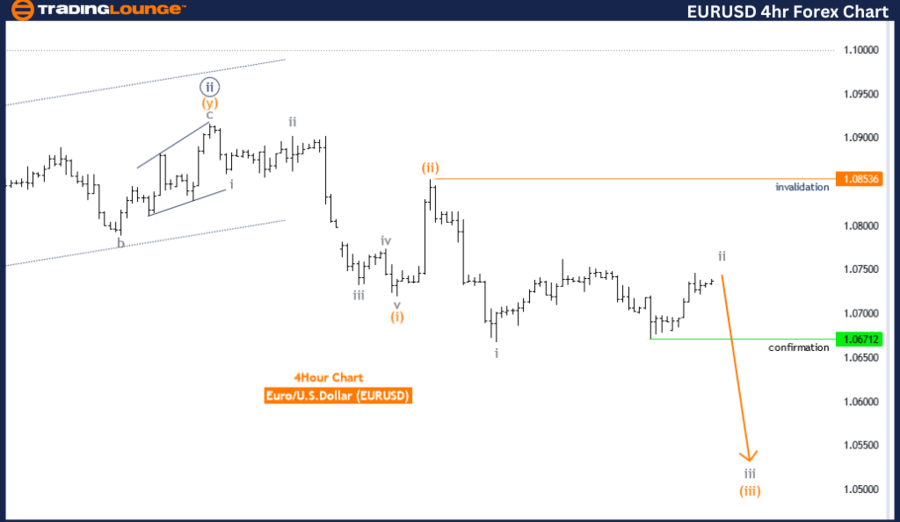
EURUSD Elliott Wave Analysis Trading Lounge 4-Hour Chart.
Euro/U.S. Dollar (EURUSD) 4-Hour Chart.
EUR/USD Elliott Wave technical analysis
Function: Trend.
Mode: Corrective.
Structure: Gray wave 2.
Position: Orange wave 3.
Next lower degree direction: Gray wave 3.
Details:
Gray wave 2 remains active as a flat. After gray wave 2, gray wave 3 of 3 is expected to begin. Wave cancellation invalid level: 1.08536.
The EURUSD Elliott Wave analysis on the 4-hour chart offers insights into the market's current trend and potential future movements based on Elliott Wave theory. This analysis identifies the trend as corrective, indicating the market is consolidating or adjusting against the larger trend.
The market structure is identified as gray wave 2, part of a larger wave sequence. The current position is orange wave 3, suggesting the market is developing the third wave of the sequence.
The next lower degrees' direction centers on gray wave 3. This indicates that once gray wave 2 completes, gray wave 3 will commence, potentially accelerating market movement in the impulsive phase.
Detailed observations indicate that gray wave 2 is still active and characterized by a flat pattern. This flat pattern signifies a sideways movement within the corrective phase, typical of wave 2 in Elliott Wave theory. The continuation of gray wave 2 suggests the market remains in a consolidation phase and has not resumed its primary trend direction.
A critical aspect of this analysis is the wave cancellation invalid level, set at 1.08536. This level is a key threshold for validating the current wave count. If the market price surpasses this level, it would invalidate the existing wave structure, necessitating a reevaluation of the Elliott Wave count and potentially altering the market outlook.
Summary:
-
Trend: Corrective within gray wave 2.
-
Position: Orange wave 3.
-
Next Move: Continuation of gray wave 2 in a flat pattern, followed by gray wave 3 of 3.
-
Key Level: 1.08536 to validate current wave count.
Technical analyst: Malik Awais.
EUR/USD Elliott Wave technical analysis [Video]
Author

Peter Mathers
TradingLounge
Peter Mathers started actively trading in 1982. He began his career at Hoei and Shoin, a Japanese futures trading company.


