EUR/USD Elliott Wave technical analysis [Video]
![EUR/USD Elliott Wave technical analysis [Video]](https://editorial.fxstreet.com/images/Markets/Currencies/Majors/EURUSD/MoneyEURUSD_1_XtraLarge.jpg)
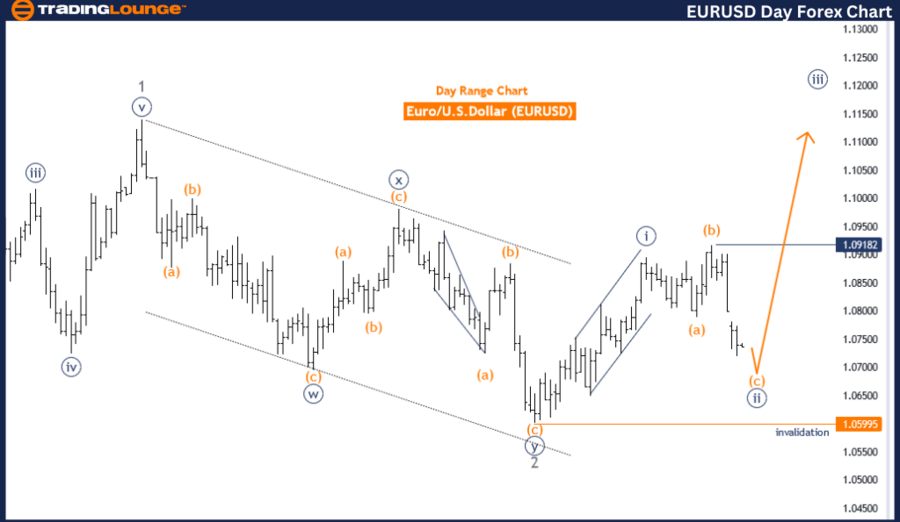
EURUSD Elliott Wave Analysis Trading Lounge 4 Hour Chart,
Euro/U.S.Dollar (EURUSD) 4 Hour Chart.
EUR/USD Elliott Wave technical analysis
Function: Counter Trend.
Mode: Corrective.
Structure: Orange Wave C.
Position: Navy Blue Wave 2.
Direction next higher degrees: Navy blue wave 3.
Details: Orange wave C of 2 still is in play, after that navy blue wave 3 will start.
Wave cancel invalid level: 1.05995.
The EURUSD Elliott Wave analysis on the 4-hour chart indicates a counter-trend movement within a corrective wave pattern identified as orange wave C. The current position of this wave structure is navy blue wave 2, suggesting that the market is undergoing a correction within a larger trend. This analysis highlights that orange wave C is still ongoing and forms part of the corrective phase of navy blue wave 2.
The primary function of this analysis is to track the counter-trend movements in the EURUSD market. The mode of this wave is corrective, indicating that the current movement is a part of the market's broader adjustment process before resuming the main trend. The wave structure identified as orange wave C implies that the market is in the final stages of this correction.
Navy blue wave 2 is the current position, indicating that the market is in the corrective phase of a larger trend. This phase is preparing for the next significant movement, which will be navy blue wave 3. The direction for the next higher degrees is identified as the commencement of navy blue wave 3, signaling a transition from the corrective phase to a new impulsive trend.
The details of the analysis suggest that orange wave C of navy blue wave 2 is still in progress. This indicates that the market is finalizing its correction before transitioning to the next impulsive phase. The completion of orange wave C will set the stage for the beginning of navy blue wave 3, which is expected to mark a new upward trend in the market.
A critical component of this analysis is the wave cancel invalid level, set at 1.05995. This level is crucial for maintaining the validity of the current wave structure. If the market price drops below this level, it would invalidate the existing wave count, necessitating a reassessment of the Elliott Wave analysis and potentially altering the expected market direction.
In summary, the EURUSD 4-hour chart analysis reveals that the market is in the final stages of a corrective phase within navy blue wave 2. The completion of orange wave C will initiate navy blue wave 3, marking the start of a new upward trend. The wave cancel invalid level at 1.05995 is essential for confirming the current wave count and guiding future market expectations based on the Elliott Wave principles.
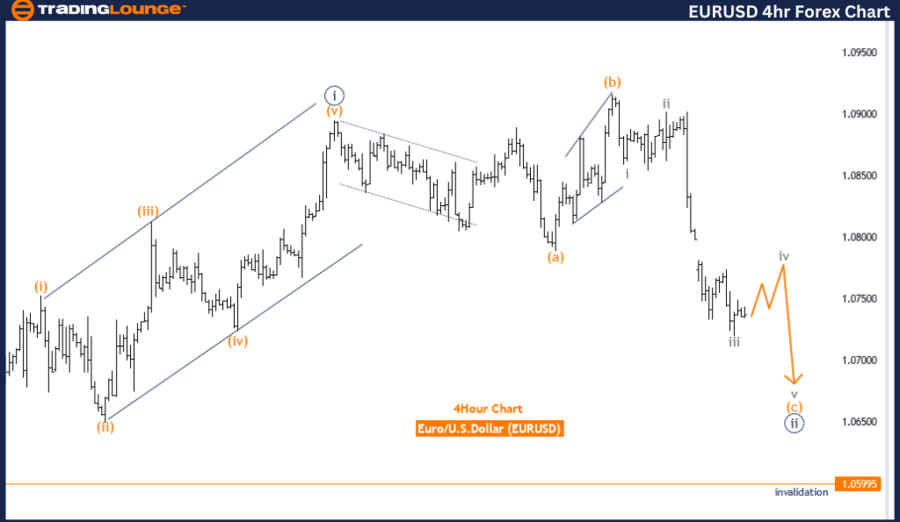
EURUSD Elliott Wave Analysis Trading Lounge 4 Hour Chart,
Euro/U.S.Dollar (EURUSD) 4 Hour Chart.
EUR/USD Elliott Wave technical analysis
Function: Counter Trend.
Mode: Impulsive as C.
Structure: Orange Wave C.
Position: Navy Blue Wave 2.
Direction next higher degrees: Navy blue wave 3.
Details: Orange wave C of 2 still is in play, after that navy blue wave 3 will start.
Wave cancel invalid level: 1.05995
The EURUSD Elliott Wave analysis on the 4-hour chart indicates a counter-trend move within an impulsive wave pattern classified as orange wave C. The current wave structure is positioned as navy blue wave 2, suggesting that the market is undergoing a correction within a larger trend. This analysis highlights that orange wave C is still in progress and is part of the larger corrective phase of navy blue wave 2.
The primary function of this analysis is to track the counter-trend movements in the EURUSD market. The mode of this wave is impulsive as it falls within wave C, which typically signifies a strong directional move that completes a corrective pattern. The wave structure identified as orange wave C implies that the market is nearing the end of the correction phase.
Navy blue wave 2 is the current position, indicating that the market is in the corrective phase of a larger trend. This wave is part of the preparation for the next significant movement, which will be navy blue wave 3. The direction for the next higher degrees is identified as the commencement of navy blue wave 3, signifying a transition from the corrective phase to a new impulsive trend.
The details of the analysis suggest that orange wave C of navy blue wave 2 is still in play. This indicates that the market is finalizing its correction before transitioning to the next impulsive phase. The completion of orange wave C will set the stage for the beginning of navy blue wave 3, which is expected to mark a new upward trend in the market.
A critical component of this analysis is the wave cancel invalid level, set at 1.05995. This level is vital for maintaining the validity of the current wave structure. If the market price drops below this level, it would invalidate the existing wave count, requiring a reassessment of the Elliott Wave analysis and potentially altering the expected market direction.
In summary, the EURUSD 4-hour chart analysis reveals that the market is in the final stages of a corrective phase within navy blue wave 2. The completion of orange wave C will initiate navy blue wave 3, marking the start of a new upward trend. The wave cancel invalid level at 1.05995 is crucial for confirming the current wave count and guiding future market expectations based on the Elliott Wave principles.
Technical analyst: Malik Awais.
EUR/USD Elliott Wave technical analysis [Video]
Author

Peter Mathers
TradingLounge
Peter Mathers started actively trading in 1982. He began his career at Hoei and Shoin, a Japanese futures trading company.


