|

EUR/USD Elliott Wave: Calling the decline and selling the rallies at the blue box

Hello fellow traders. Another instrument that has given us nice trading set up recently is EURUSD Forex Pair. In this technical article, we’re going to take a look at the past charts of $EURUSD presented in the member's area of the Elliottwave-Forecast. EURUSD is showing bearish impulsive sequences in the cycle from the May peak. We got a short-term recovery wave 4 that has given us the opportunity to enter short trades again. In the further text, we’re going to explain the forecast and trading strategy.

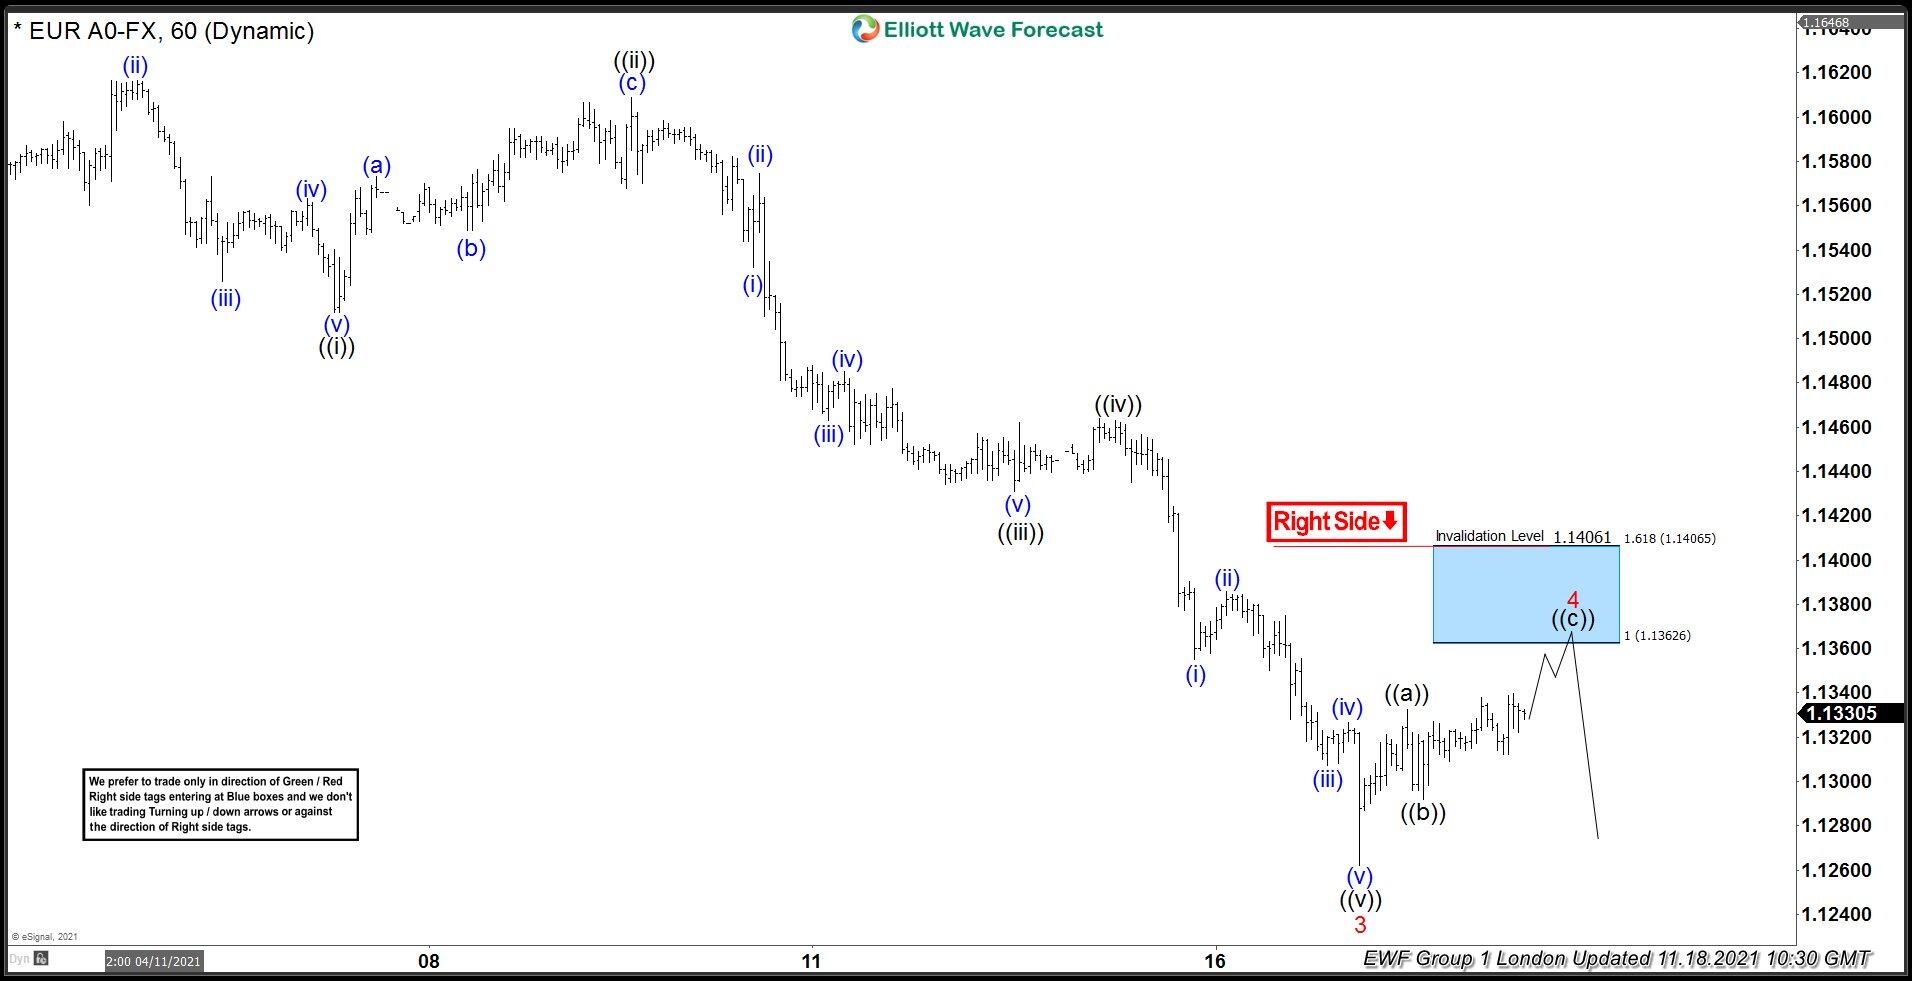
EUR/USD 1 hour Elliott Wave analysis 11.18.2021

EURUSD is giving us 4 red recoveries that are unfolding as Elliott Wave Zig Zag Pattern. It’s having ((a))((b)) ((c)) inner labeling. Recovery looks incomplete at the moment, suggesting more short-term strength. The Forex Pair is looking for a 1.1362-1.1406 area, to complete 4 red recoveries. At the marked blue box area, we expect intraday sellers to appear and to pull price lower toward new lows or in 3 waves pull back alternatively. Invalidation level for the trade is broken above 1.618 fib extension (1.14065).

EURUSD

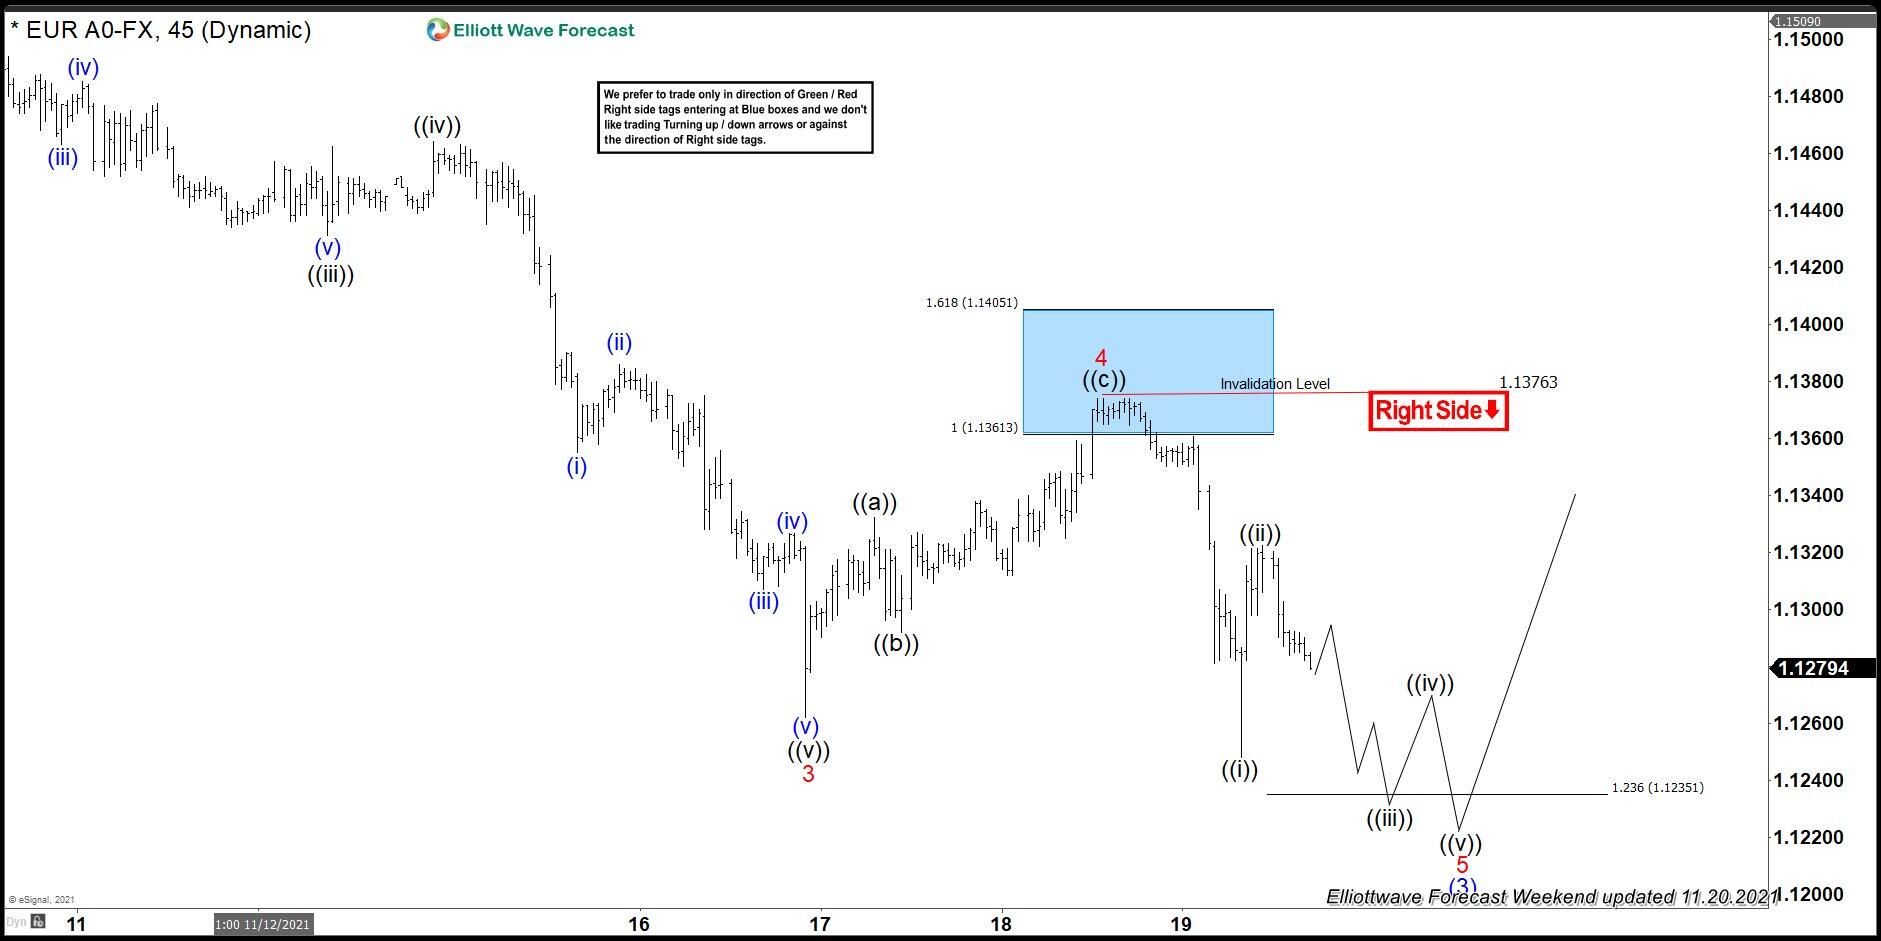
EUR/USD 1 hour Elliott Wave analysis 11.20.2021

Sellers appeared at the blue box and we got good reaction from there. The decline from the blue box unfolded as 5 waves and the price made a break toward new lows. As a result, short positions from the blue box are Risk-Free and partial profit is taken. At this stage, the pair remains bearish against the 1.3763 high. As our members know, Blue Boxes are no enemy areas, giving us an 85% chance to get a reaction.

EURUSD

Author

Elliott Wave Forecast Team

Elliott Wave Forecast Team

ElliottWave-Forecast.com

More from Elliott Wave Forecast Team
Share:

Editor's Picks

EUR/USD looks weak below 1.1800

EUR/USD has slipped back under pressure, breaking through the 1.1800 support and drifting towards the weekly lows near 1.1770 ahead of the opening bell in Asia. The move reflects renewed strength in the US Dollar, with steady geopolitical tensions keeping its demand firm. Moving forward, the release of the German labour market report and flash inflation figures should keep European investors entertained on Friday.
 

GBP/USD threatens the 200-day SMA near 1.3440

GBP/USD rapidly leaves behind Wednesday’s strong advance, coming under heavy pressure and retesting the 1.3440 zone, where the critical 200-day SMA is located. Cable’s deep pullback follows the strong gains in the Greenback, while investors continue to pencil in a potential BoE rate cut in March.

Gold trims gains, slips back to around $5,170

Gold is now facing some downside pressure, hovering around the $5,170 region on Thursday. The yellow metal surrenders part of its earlier gains on the back of the resurgence of the buying interest in the Greenback. In the meantime, geopolitical tensions in the Middle East continue to limit the downside potential for now.

How AI, blockchain, stablecoins are shaping a new global economy – Circle CEO Jeremy Allaire

Artificial Intelligence (AI), blockchain technology and stablecoins are emerging as core pillars of a new global economic system, according to Circle’s CEO, Jeremy Allaire.

Changing the game: International implications of recent tariff developments

The Supreme Court ruling on International Emergency Economic Powers Act (IEEPA) tariffs provides limited relief for the rest of the world, with weighted average tariff rates modestly lower.

Bitcoin steadies as traders eye US–Iran talks

Bitcoin (BTC) price is stabilizing around $68,000 at the time of writing on Thursday after a 6.2% relief rally the previous day amid a broader downward trend.