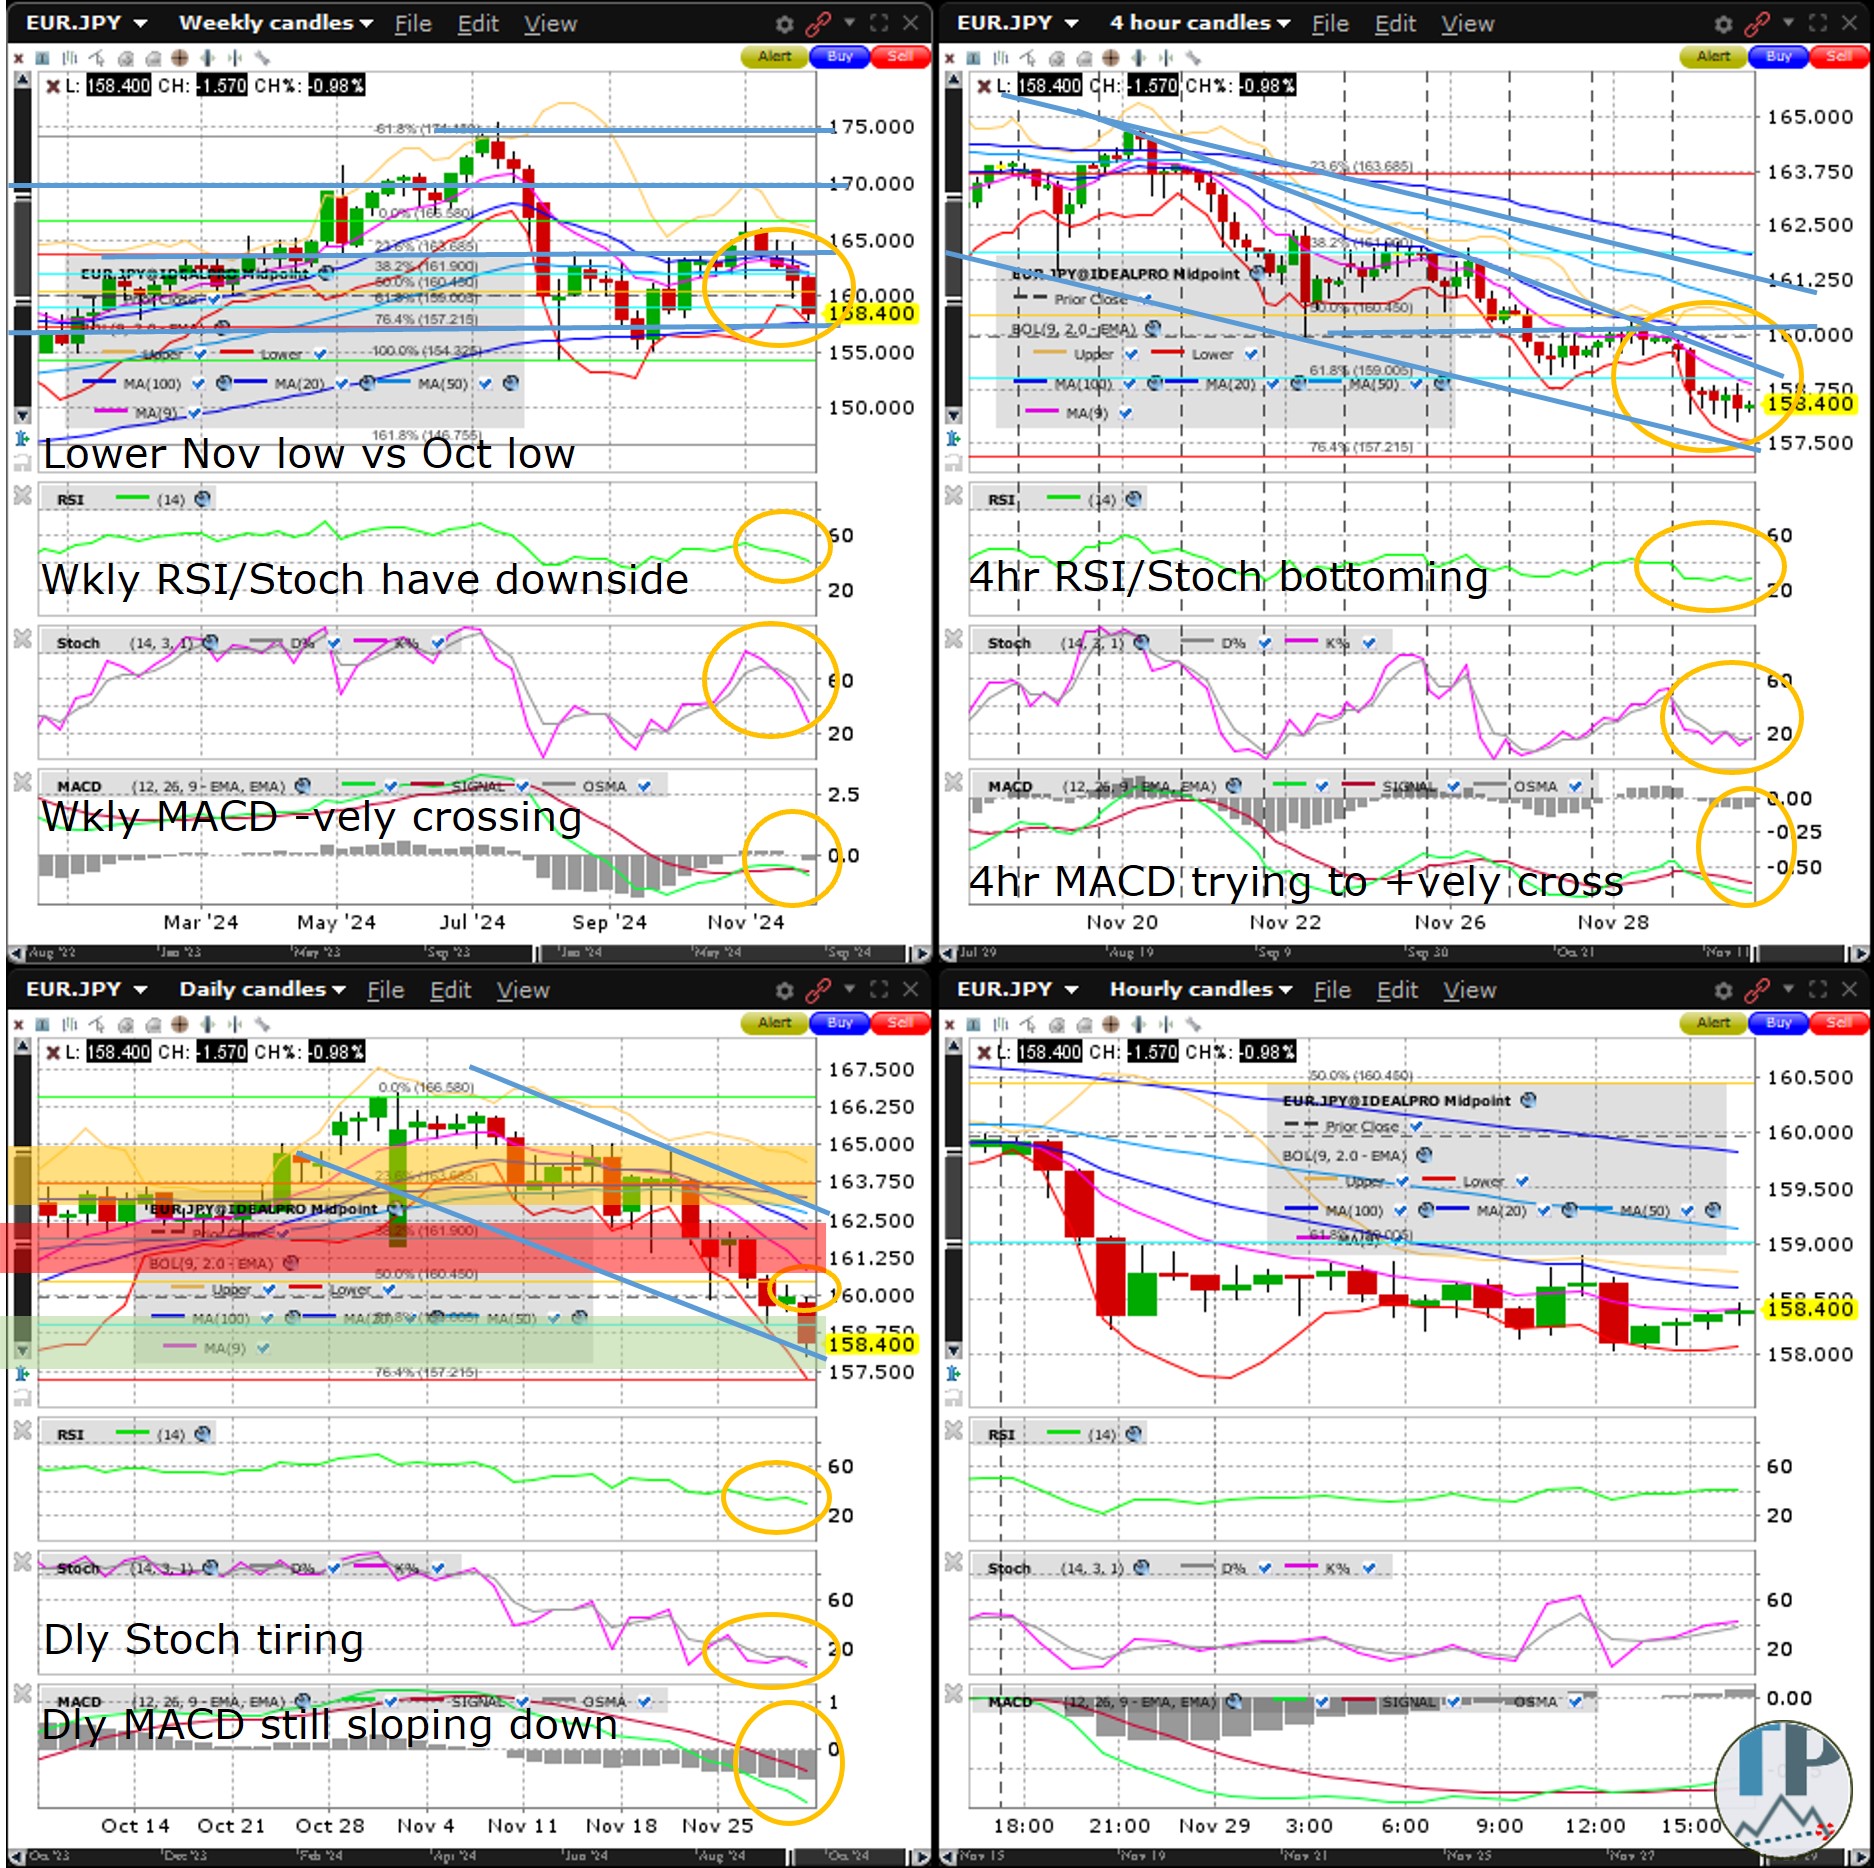
EUR/JPY unwinds approx 2/3rds of bounce off August low

The EURJPY slid a massive 300 plus pips Friday, closing November at the low of the month below the October low. The EURJPY has now unwound roughly two thirds of the bounce off the August low. With the red November candle (as can be seen on a monthly chart on tradingview.com) having bearishly engulfed the October green candle, odds are now elevated for a retest of the August low by January sometime. Interestingly, the 38.2% Fib retrace of the Bull Market from June 2016 to July 2024 coincides with the December 2014 peak. Nevertheless, with the EURJPY near what is arguably downtrend support (on the 4hr chart), some short covering may kick in as early as Monday with the US ISM manufacturing PMI or Tuesday with the US Jolts job openings. The odds for downside volatility returning rises Wednesday with the US ADP non-farm employment change, ISM services PMI, and Fed Chair Powell’s comments. Watch for more volatility Thursday with the US unemployment claims, and Friday with the US average hourly earnings, Non-Farm employment and unemployment rate. The weekly and daily RSI, Stochastics and MACD are tiring or steadily sloping down. I am looking at going short in the red zone (of the daily chart), targeting the green zone for Friday. The amber/yellow zone is where I might place a stop if I was a swing trader (although in my personal account with which I seldom hold overnight I sometimes set my stops tighter).
Author

Darren Chu, CFA
Tradable Patterns
Darren Chu, CFA, ex-Intercontinental Exchange | NYSE Liffe, TMX Group, CMC Markets, is the founder of Tradable Patterns – a publisher of futures/FX technical analysis on Bloomberg, LSEG (Refinitiv) and Factset.


