In this technical blog we’re going to take a quick look at the Elliott Wave charts of EURJPY , published in members area of the website.  As our members know, we’ve been favoring the long side in EURJPY due to incomplete bullish sequences the pair is showing in the cycles from the June 2016 and May 2020 lows. Recently EURJPY made a pull back that has had a form of Elliott Wave Zig Zag pattern that has given us good trading opportunities.  We expected EURJPY to find buyers at the extreme zone from the 04/21 peak. In the further text we are going to explain the Elliott Wave Pattern and trading strategy.

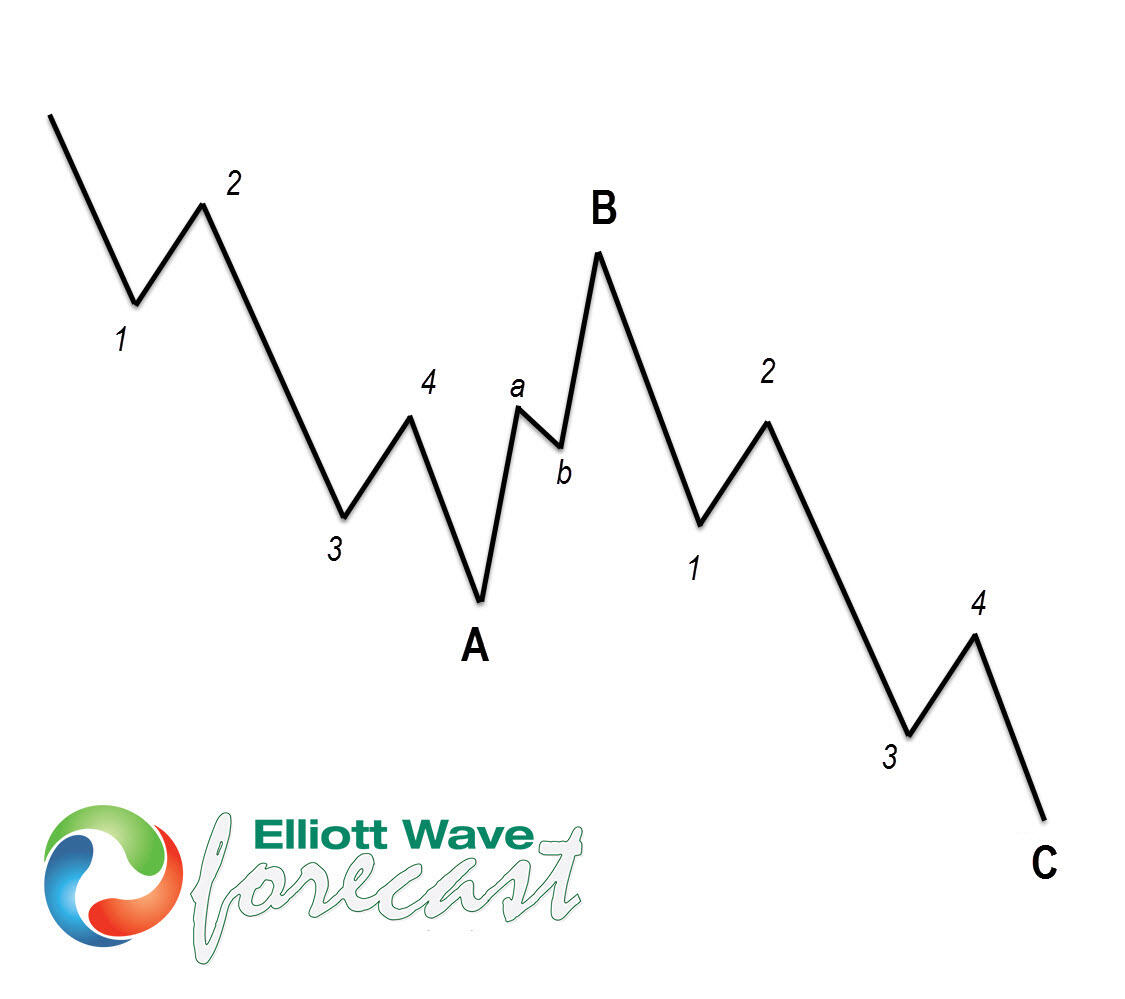
Before we take a look at the real market example, let’s explain Elliott Wave Zigzag.

Elliott Wave Zigzag is the most popular corrective pattern in Elliott Wave theory. It’s made of 3 swings which have 5-3-5 inner structure. Inner swings are labeled as A,B,C where A =5 waves, B=3 waves and C=5 waves. That means A and C can be either impulsive waves or diagonals. (Leading Diagonal in case of wave A  or Ending in case of wave C) . Waves A and C must meet all conditions of being 5 wave structure, such as: having RSI divergency between wave subdivisions, ideal Fibonacci extensions and ideal retracements.

Chart

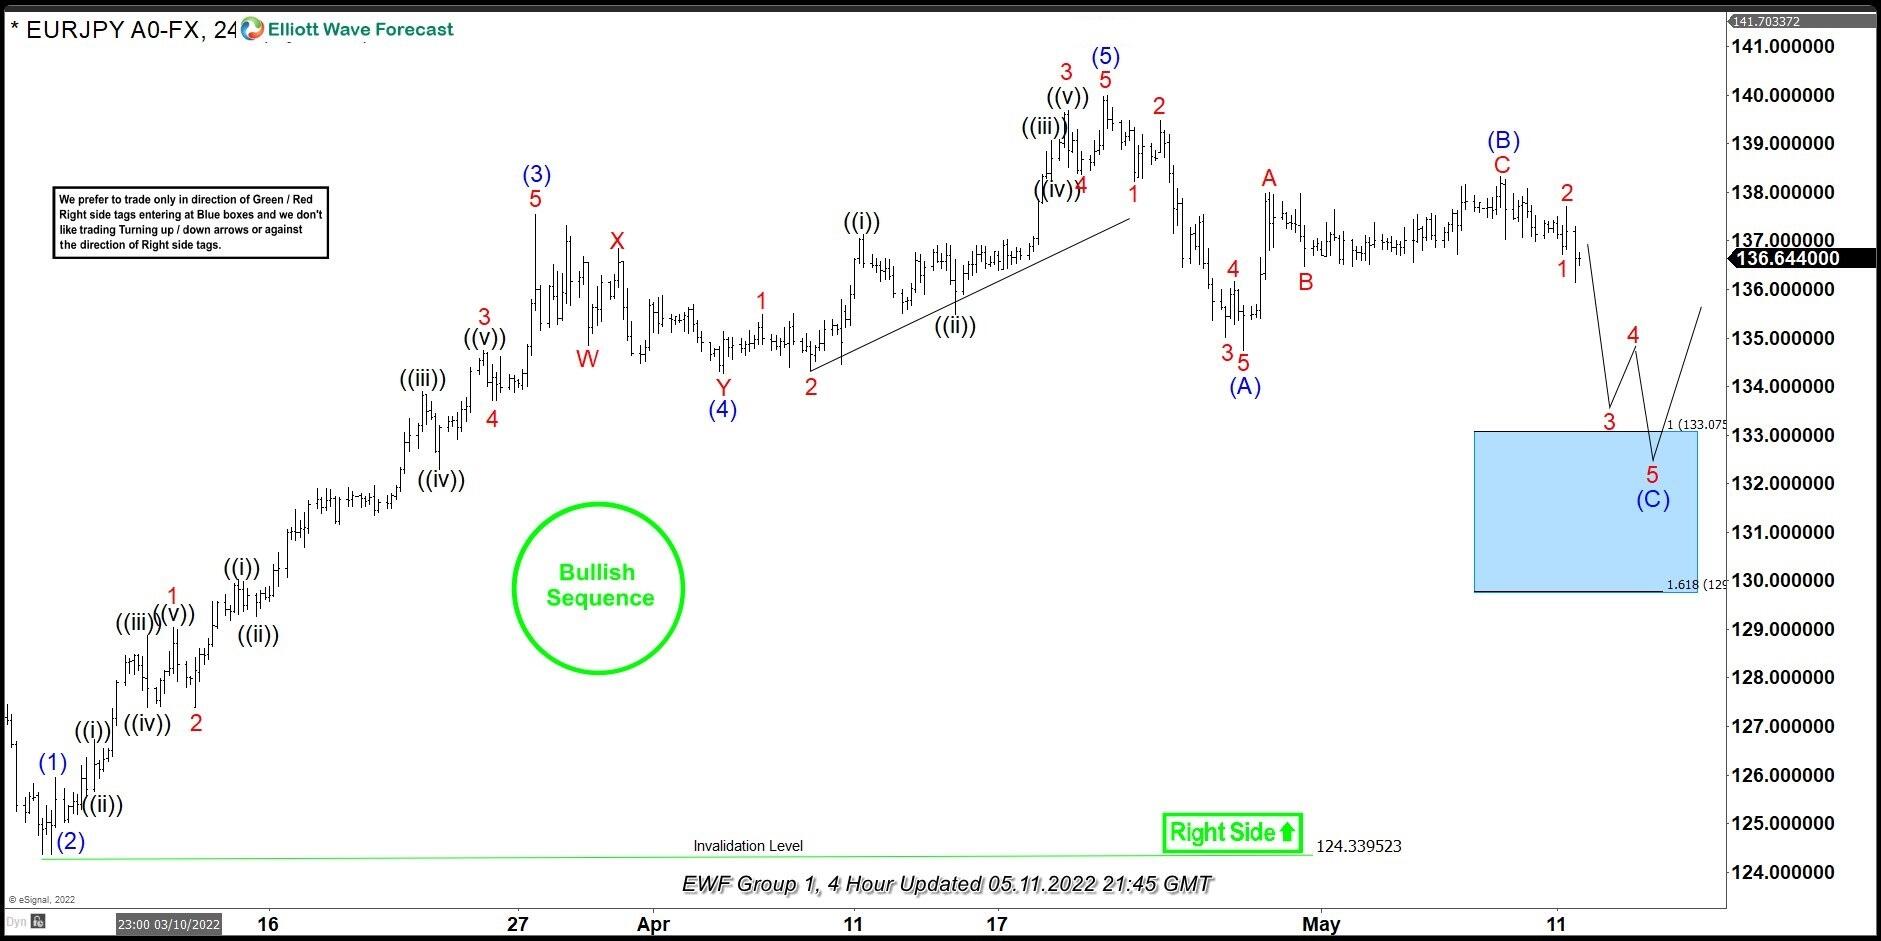
EUR/JPY Elliott Wave 4 hour chart 05.11.2022

Current view suggests EURJPY is doing black pull back against the 124.33 low.  Decline from the peak looks like 5 waves structure, which means cycle from the peak is incomplete. Most likely we got only first leg of the pull back. Recovery against the 04/21 peak ended as truncated Zig Zag pattern – (B) blue.  Current view suggests (C) leg is in progress toward 133.075-129.77 area ( Blue Box) .
We don’t recommend selling the pair against the main bullish trend. The strategy is waiting for the price to reached marked blue box zone, before buying the pair again. As the main trend is bullish we expect buyers to appear at the blue box for 3 waves bounce at least. Once bounce reaches 50 Fibs against the ((x)) black high, we will make long position risk-free ( put SL at BE). Invalidation for the trade would be break of marked invalidation level 129.77.

As our members know, Blue Boxes are no enemy areas , giving us 85% chance to get a bounce.

EURJPY

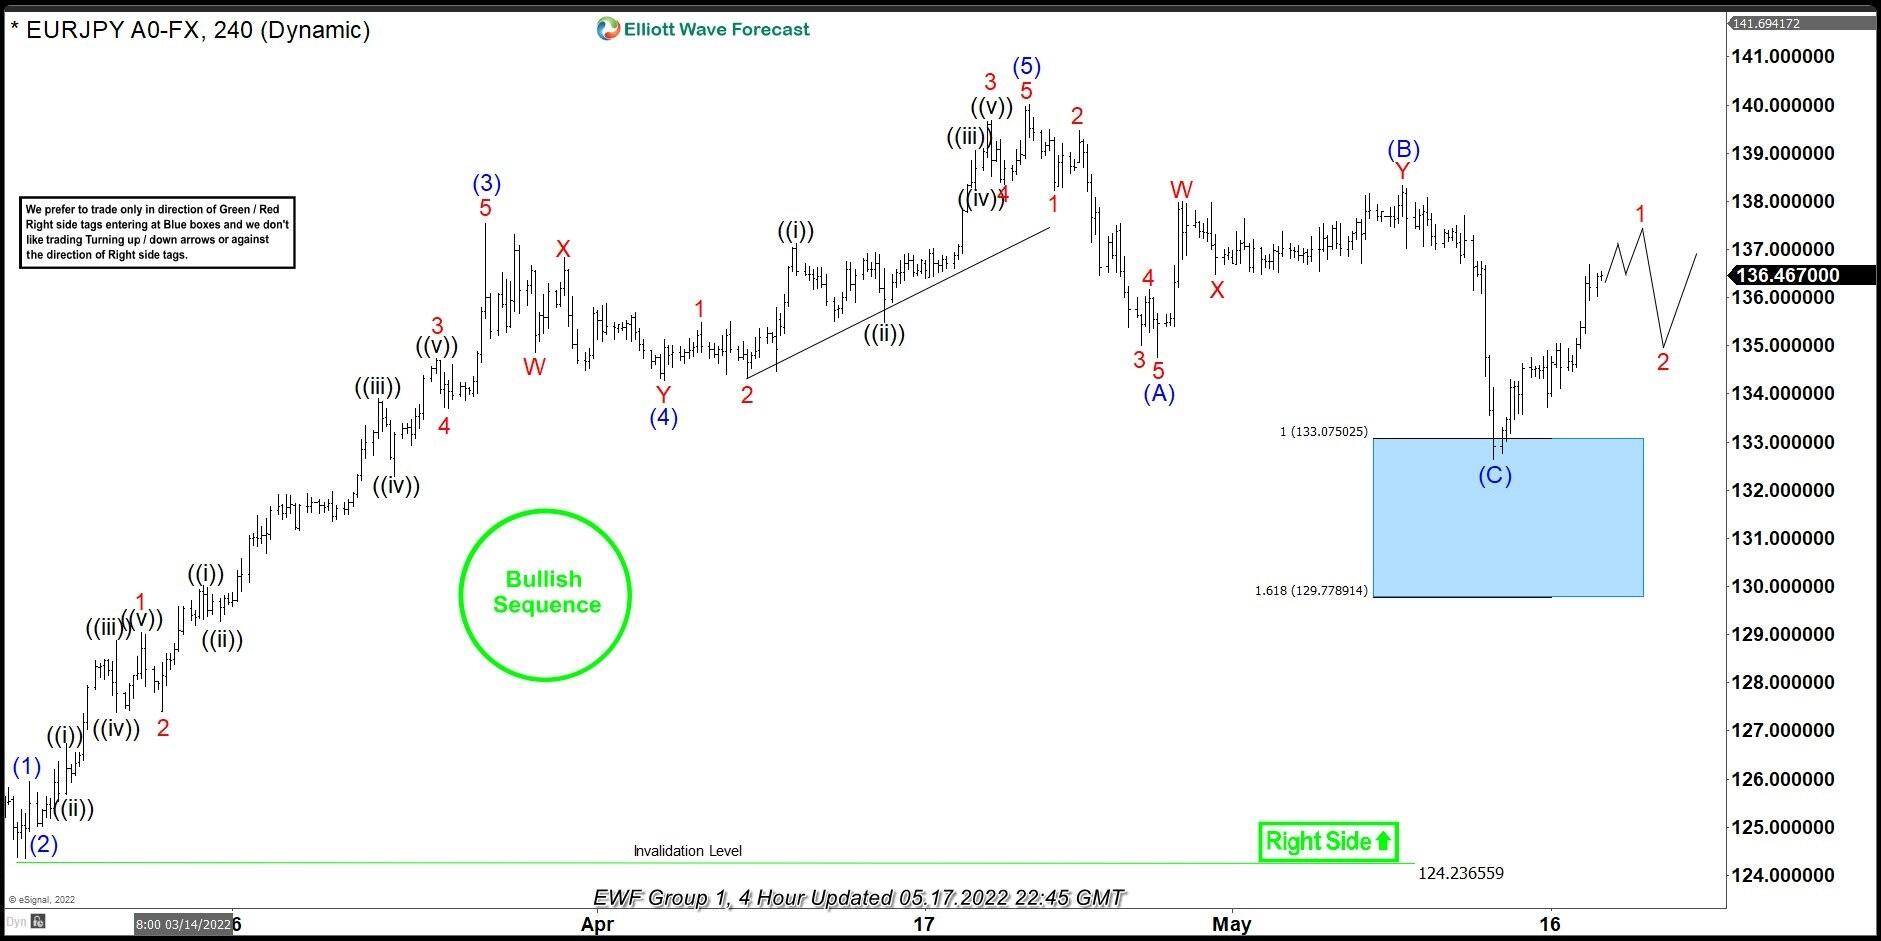
EUR/JPY Elliott Wave 4 hour chart 05.12.2022

Eventually EURJPY made proposed leg down as we expected. The pair has found buyers at the Blue Box area and we are getting good reaction from there.  Pull back completed at 132.621 low as a  Zig Zag pattern. The rally from the blue box reached and exceeded 50 fibs against the (B) connector. Consequently, members who have taken the long trades at the blue box now enjoying profits in a risk free trades. Now we would need to see break of  April 21st peak in order to confirm next leg up is in progress. Once the pair breaks 04/21 high, the pair will become bullish again in near term and might offer some new buying opportunities in the short term dips against  the 132.621 low.

eurjpy

FURTHER DISCLOSURES AND DISCLAIMER CONCERNING RISK, RESPONSIBILITY AND LIABILITY Trading in the Foreign Exchange market is a challenging opportunity where above average returns are available for educated and experienced investors who are willing to take above average risk. However, before deciding to participate in Foreign Exchange (FX) trading, you should carefully consider your investment objectives, level of xperience and risk appetite. Do not invest or trade capital you cannot afford to lose. EME PROCESSING AND CONSULTING, LLC, THEIR REPRESENTATIVES, AND ANYONE WORKING FOR OR WITHIN WWW.ELLIOTTWAVE- FORECAST.COM is not responsible for any loss from any form of distributed advice, signal, analysis, or content. Again, we fully DISCLOSE to the Subscriber base that the Service as a whole, the individual Parties, Representatives, or owners shall not be liable to any and all Subscribers for any losses or damages as a result of any action taken by the Subscriber from any trade idea or signal posted on the website(s) distributed through any form of social-media, email, the website, and/or any other electronic, written, verbal, or future form of communication . All analysis, trading signals, trading recommendations, all charts, communicated interpretations of the wave counts, and all content from any media form produced by www.Elliottwave-forecast.com and/or the Representatives are solely the opinions and best efforts of the respective author(s). In general Forex instruments are highly leveraged, and traders can lose some or all of their initial margin funds. All content provided by www.Elliottwave-forecast.com is expressed in good faith and is intended to help Subscribers succeed in the marketplace, but it is never guaranteed. There is no “holy grail” to trading or forecasting the market and we are wrong sometimes like everyone else. Please understand and accept the risk involved when making any trading and/or investment decision. UNDERSTAND that all the content we provide is protected through copyright of EME PROCESSING AND CONSULTING, LLC. It is illegal to disseminate in any form of communication any part or all of our proprietary information without specific authorization. UNDERSTAND that you also agree to not allow persons that are not PAID SUBSCRIBERS to view any of the content not released publicly. IF YOU ARE FOUND TO BE IN VIOLATION OF THESE RESTRICTIONS you or your firm (as the Subscriber) will be charged fully with no discount for one year subscription to our Premium Plus Plan at $1,799.88 for EACH person or firm who received any of our content illegally through the respected intermediary’s (Subscriber in violation of terms) channel(s) of communication.

Recommended Content


Recommended Content

Editors’ Picks

AUD/USD eases from two-month peak ahead of RBA decision

AUD/USD eases from two-month peak ahead of RBA decision

AUD/USD trades with a mild negative bias below a two-month top touched on Monday amid some repositioning trade ahead of the widely expected rate cut by the RBA. Investors will also scrutinize the accompanying policy statement and comments from RBA Governor Michele Bullock for cues about the future rate-cut path.

AUD/USD News
USD/JPY seems vulnerable amid rising BoJ rate hike bets

USD/JPY seems vulnerable amid rising BoJ rate hike bets

USD/JPY rebounds from over a one-week low, though the upside seems capped as Japan's strong GDP print reaffirmed bets for more BoJ rate hikes this year. Moreover, the optimism over a delay in Trump's reciprocal tariffs and the narrowing of the US-Japan rate differential should underpin the JPY and cap the pair amid a weaker USD.

USD/JPY News
Gold price consolidates around $2,900; bullish bias remains

Gold price consolidates around $2,900; bullish bias remains

Gold price extends its sideways consolidative price move around the $2,900 mark on Tuesday amid mixed cues. Worries about a global trade war and the recent USD downfall continue to underpin the bullion. However, hawkish Fed expectations cap the yellow metal amid a positive risk tone.

Gold News
RBA expected to deliver first interest rate cut in over four years

RBA expected to deliver first interest rate cut in over four years

The Reserve Bank of Australia will announce its first monetary policy decision of 2025 on Tuesday, and market participants anticipate the Board will cut the benchmark interest rate by 25 basis points.

Read more
Bitcoin Price Forecast: BTC stalemate soon coming to an end

Bitcoin Price Forecast: BTC stalemate soon coming to an end

Bitcoin price has been consolidating between $94,000 and $100,000 for almost two weeks. Amid this consolidation, investor sentiment remains indecisive, with US spot ETFs recording a $580.2 million net outflow last week, signaling institutional demand weakness.

Read more
The Best Brokers of the Year

The Best Brokers of the Year

SPONSORED Explore top-quality choices worldwide and locally. Compare key features like spreads, leverage, and platforms. Find the right broker for your needs, whether trading CFDs, Forex pairs like EUR/USD, or commodities like Gold.

Read More

Majors

Cryptocurrencies

Signatures

Best Brokers of 2025