EUR/GBP Elliott Wave technical analysis [Video]
![EUR/GBP Elliott Wave technical analysis [Video]](https://editorial.fxstreet.com/images/Markets/Currencies/Crosses/EURGBP/iStock-804351208_XtraLarge.jpg)
EUR/GBP Elliott Wave technical analysis
-
Function: Bearish Trend.
-
Mode: Impulsive.
-
Structure: Orange Wave 1.
-
Position: Navy Blue Wave 3.
-
Direction next higher degrees: Orange Wave 2.
-
Details: Navy blue wave 2 appears complete, with orange wave 1 of navy blue wave 3 currently in motion.
- Wave cancelation invalid level: 0.84490
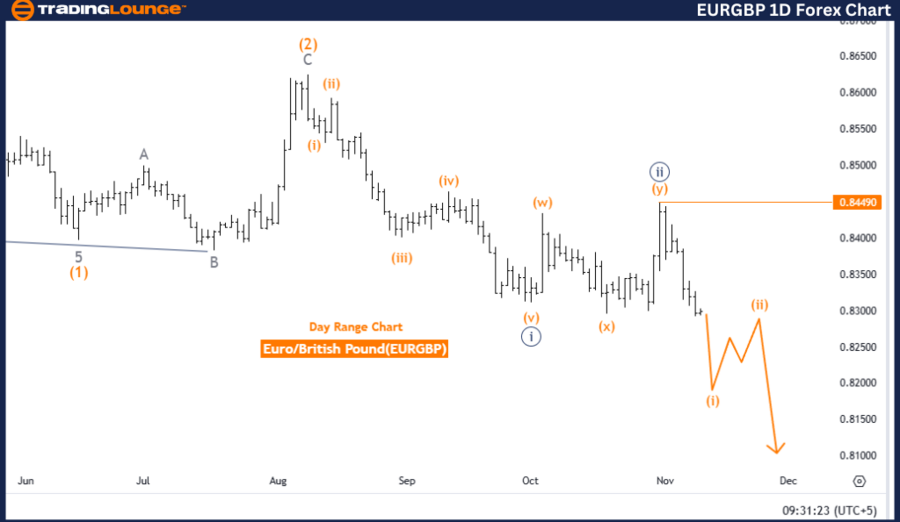
The EURGBP Day Chart, based on Elliott Wave analysis, demonstrates a bearish trend with an impulsive wave structure. The current setup includes orange wave 1 within navy blue wave 3, indicating a continuation of the downward trajectory in line with the broader trend.
The analysis highlights that navy blue wave 2 has likely concluded, leading to the development of orange wave 1 within navy blue wave 3. This formation fits a classic impulsive Elliott Wave structure, supporting the overall bearish outlook.
Navy blue wave 3, as the current position within the larger wave pattern, underscores the downward momentum. The higher-degree direction aims for orange wave 2, which suggests that any upward movements are expected to be corrective and part of the larger bearish framework. Consequently, potential rallies may be short-lived and unlikely to signify a reversal of the bearish trend.
Key level
The invalidation level for the current wave structure is 0.84490. A move above this level would invalidate the current bearish count, necessitating a reassessment of the wave structure. Conversely, maintaining levels below 0.84490 supports the validity of the current Elliott Wave configuration and the bearish trend.
Summary
The EURGBP Day Chart analysis points to a bearish trend driven by an impulsive orange wave 1 within navy blue wave 3. The expectation is for continued declines as part of the broader downward trend. Monitoring the invalidation level at 0.84490 is crucial for confirming the validity of the current structure, with the primary outlook remaining bearish as long as this level is not breached.
EUR/GBP day chart
EUR/GBP Elliott Wave technical analysis
-
Function: Bearish Trend.
-
Mode: Impulsive.
-
Structure: Orange Wave 1.
-
Position: Navy Blue Wave 3.
-
Direction next higher degrees: Orange Wave 2.
-
Details: Navy blue wave 2 seems complete, with orange wave 1 of navy blue wave 3 currently unfolding.
-
Wave cancelation invalid level: 0.84490.
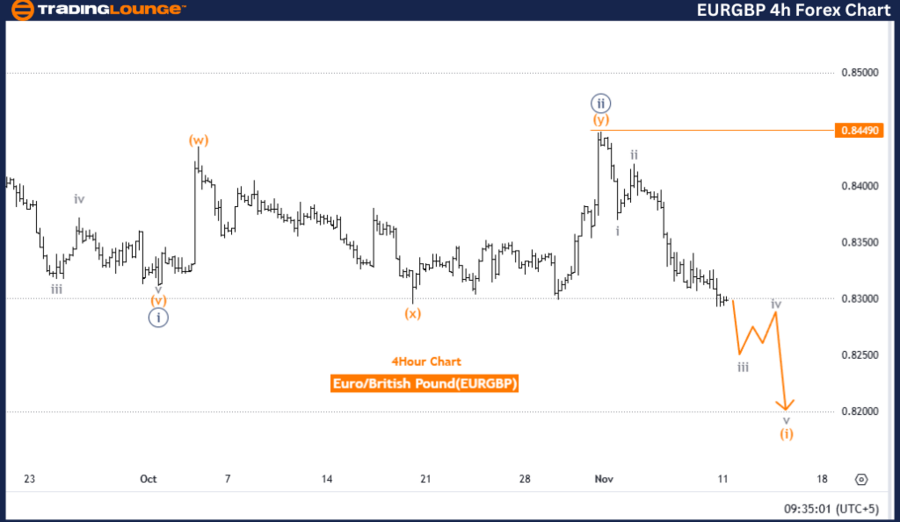
The EURGBP 4-Hour Chart, interpreted through Elliott Wave analysis, reveals a bearish trend characterized by an impulsive wave structure. This setup shows that orange wave 1 has initiated within navy blue wave 3, suggesting continued downward momentum as the wave sequence progresses.
The analysis indicates that navy blue wave 2 is likely completed, paving the way for orange wave 1 to move lower. This marks the beginning of navy blue wave 3’s downward phase, aligning with the impulsive nature of Elliott Wave patterns. These waves emphasize a directional trend that supports the broader market movement.
The current position of navy blue wave 3 within the wave hierarchy confirms the bearish bias. The potential emergence of orange wave 2 in the near term indicates that any upward movements may serve as corrective phases rather than a shift in the primary trend. This structure reflects a continuation of the overall downward trajectory, reinforcing the bearish outlook.
Key level
The wave invalidation level is 0.84490. If prices rise above this level, the current bearish count would be invalidated, necessitating a reevaluation of the wave structure. Remaining below 0.84490, however, sustains the validity of the bearish wave count and supports continued declines within the impulsive wave framework.
Summary
The EURGBP 4-Hour Chart analysis identifies a bearish trend driven by the impulsive orange wave 1 within navy blue wave 3. This wave progression points to further declines, with the invalidation level at 0.84490 serving as a critical threshold for maintaining the current wave structure. As long as this level holds, the dominant trend remains bearish.
EUR/GBP four-hour chart
EUR/GBP Elliott Wave technical analysis [Video]
Author

Peter Mathers
TradingLounge
Peter Mathers started actively trading in 1982. He began his career at Hoei and Shoin, a Japanese futures trading company.


