EUR/GBP Elliott Wave technical analysis [Video]
![EUR/GBP Elliott Wave technical analysis [Video]](https://editorial.fxstreet.com/images/Markets/Currencies/Crosses/EURGBP/iStock-1051145558_XtraLarge.jpg)
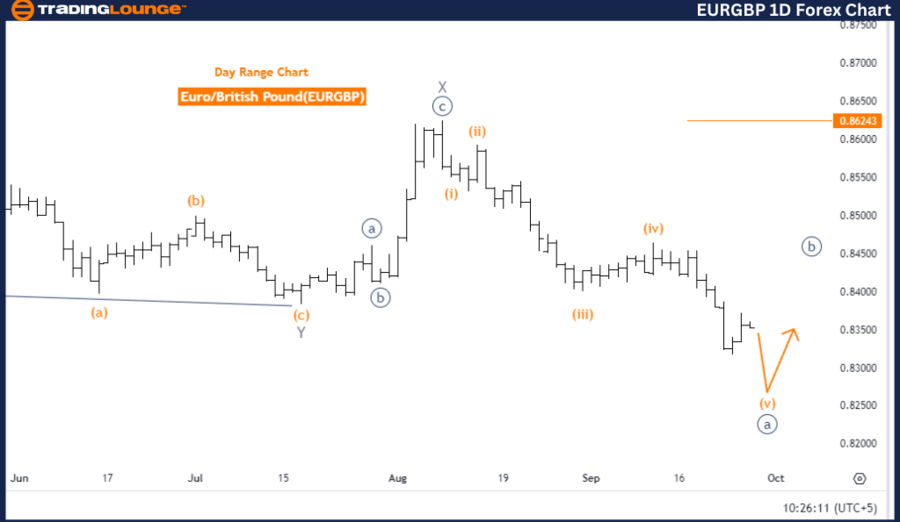
EUR/GBP Elliott Wave Analysis Trading Lounge day chart.
EUR/GBP Elliott Wave technical analysis
Function: Counter Trend.
Mode: Impulsive.
Structure: Orange Wave 5.
Position: Navy Blue Wave A.
Direction next higher degrees: Navy Blue Wave B.
Details: Orange Wave 4 appears completed, with Orange Wave 5 in progress.
Wave cancel invalid level: 0.86243.
The EURGBP Day Chart, based on Elliott Wave analysis, identifies a counter-trend structure. The current chart shows an impulsive mode with Orange Wave 5 unfolding. Orange Wave 4 has likely completed, and now Orange Wave 5 is active, indicating a continuation of the impulsive trend.
The market is positioned in Navy Blue Wave A, part of a larger wave cycle. The next higher degree movement will likely lead into Navy Blue Wave B. This suggests that after Orange Wave 5 and Navy Blue Wave A conclude, the market may enter a corrective phase, corresponding to Navy Blue Wave B, signaling a temporary reversal of the current counter-trend.
A key aspect of this analysis is the wave invalidation level at 0.86243. If the price moves above this level, the current wave structure would be invalid, indicating a potential trend shift or requiring a reevaluation of the wave count. However, as long as the price remains below this level, the current counter-trend structure holds, and further development of Orange Wave 5 is anticipated.
In summary, the EURGBP Day Chart shows that Orange Wave 4 has completed, and Orange Wave 5 is in play as part of a broader counter-trend movement. The market is in Navy Blue Wave A, with the potential for a corrective phase in Navy Blue Wave B once the current impulsive wave completes. The invalidation level of 0.86243 remains crucial for determining whether the current wave structure will persist.
EUR/GBP Four-hour chart
EUR/GBP Elliott Wave technical analysis
Function: Bearish Trend.
Mode: Impulsive.
Structure: Gray Wave 5.
Position: Orange Wave 5.
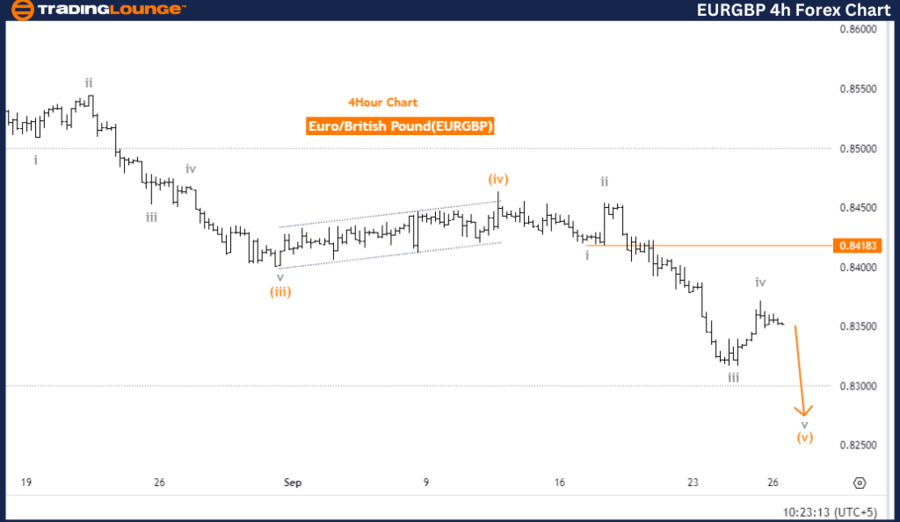
Details: Gray Wave 4 appears completed, with Gray Wave 5 now in progress.
Wave cancel invalid level: 0.84183.
The EURGBP 4-hour chart reflects a bearish trend based on Elliott Wave analysis. The market is currently in an impulsive mode, with Gray Wave 5 unfolding. This indicates that the prior corrective wave, Gray Wave 4, has completed, and the price is now advancing through the final phase of the wave cycle: Gray Wave 5.
As Gray Wave 5 develops, a continuation of the downward movement is expected, following the completion of the corrective phase in Gray Wave 4. This reinforces the ongoing impulsive bearish trend, signaling that the market is approaching the end of this wave cycle.
Traders monitoring the progression of Orange Wave 5 should be mindful of the possibility of further declines as this wave unfolds.
A key aspect of this analysis is the wave cancel invalidation level at 0.84183. If the price rises above this threshold, the current bearish wave structure would be invalid, indicating a potential trend reversal or necessitating a reevaluation of the wave count. However, as long as the price remains below this level, the bearish impulsive wave count holds, and further downward movement is anticipated.
In conclusion, the EURGBP 4-hour chart shows the completion of Gray Wave 4 and the ongoing development of Gray Wave 5, suggesting a bearish trend. Traders should closely monitor the invalidation level of 0.84183, as surpassing this level would invalidate the current wave structure. Continued bearish movement is expected as Orange Wave 5 progresses within the overall structure of Gray Wave 5.
EUR/GBP Elliott Wave technical analysis [Video]
Author

Peter Mathers
TradingLounge
Peter Mathers started actively trading in 1982. He began his career at Hoei and Shoin, a Japanese futures trading company.


