EUR/GBP Elliott Wave technical analysis [Video]
![EUR/GBP Elliott Wave technical analysis [Video]](https://editorial.fxstreet.com/images/Markets/Currencies/Crosses/EURGBP/eurgbp_XtraLarge.jpg)
EUR/GBP Elliott Wave technical analysis
-
Function: Counter Trend.
-
Mode: Impulsive.
-
Structure: Navy blue wave 3.
-
Position: Gray wave C.
-
Direction (next higher degrees): Navy blue wave 3 (started).
-
Details: Navy blue wave 2 appears completed, with navy blue wave 3 now in play.
-
Wave cancellation invalidation level: 0.84005.
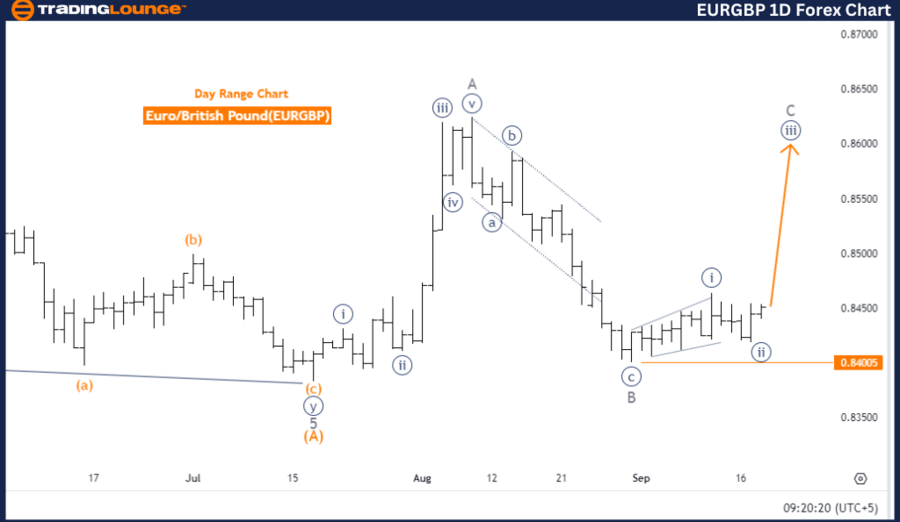
The EURGBP Elliott Wave analysis on the daily chart points to the market being in a counter-trend phase, characterized by impulsive movement. The focus is on navy blue wave 3, indicating that the market is moving in line with this wave, a crucial element of the Elliott Wave pattern.
Currently, the market is situated within gray wave C, which forms part of the broader navy blue wave 3 development. This transition marks the conclusion of navy blue wave 2, and the initiation of the impulsive phase of wave 3.
In Elliott Wave theory, wave 3 is typically a strong and extended movement, suggesting the market will likely move with significant momentum in the current trend's direction.
The analysis indicates that navy blue wave 2 is complete, and navy blue wave 3 is now driving the market forward, continuing the impulsive move. This shift from corrective wave 2 to impulsive wave 3 suggests a strong continuation of the trend.
The invalidation level for this wave count is at 0.84005, meaning if the price drops below this threshold, the current Elliott Wave analysis would no longer be valid, prompting a reevaluation of the wave structure. However, as long as the price stays above this level, the impulsive wave 3 is expected to proceed undisturbed.
Summary
The EURGBP pair on the daily chart is progressing through an impulsive phase, with navy blue wave 3 currently unfolding. As long as the price remains above the invalidation level of 0.84005, the impulsive movement is expected to continue without interruption.
EUR/GBP four-hour chart overview
-
Function: Counter Trend.
-
Mode: Impulsive.
-
Structure: Navy blue wave 3.
-
Position: Gray wave C.
-
Direction (next higher degrees): Navy blue wave 3 (started).
-
Details: Navy blue wave 2 appears completed, and navy blue wave 3 is now in play.
-
Wave cancellation invalidation level: 0.84181.
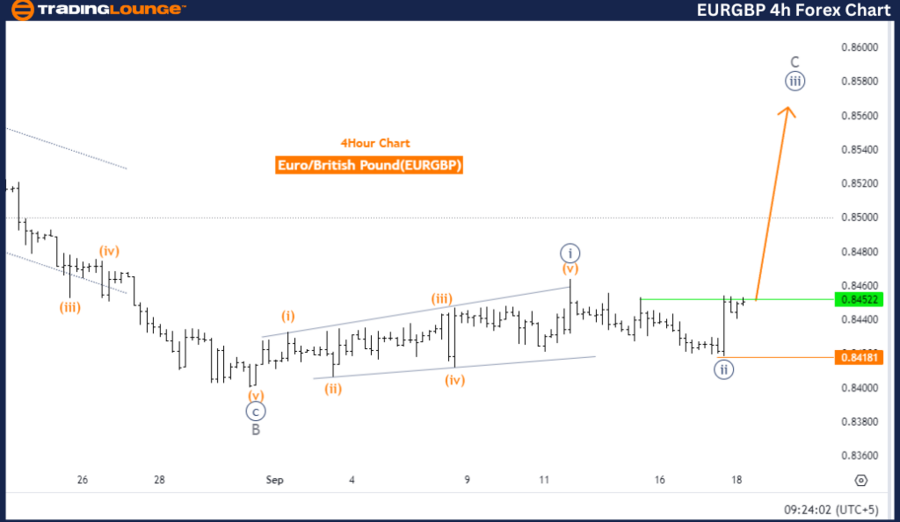
The EURGBP Elliott Wave analysis on the 4-hour chart indicates that the market is in a counter-trend phase, operating within an impulsive mode. The main focus is on navy blue wave 3, which signifies that the market is gaining momentum in line with this wave's direction.
Currently, the market is situated within gray wave C, which forms part of the larger navy blue wave 3 development. Following the completion of navy blue wave 2, the market has now transitioned into the impulsive phase of wave 3.
According to Elliott Wave theory, wave 3 typically represents a strong directional movement, and the analysis reflects this, suggesting that the current trend is likely to continue in this direction.
The navy blue wave 2 has been marked as completed, and the market is now unfolding navy blue wave 3, which follows wave 2’s corrective phase. Wave 3 is typically the most powerful wave in the Elliott Wave sequence, indicating the potential for strong market movements in the current trend's direction.
The invalidation level for this wave count is set at 0.84181, meaning that if the price falls below this point, the current Elliott Wave analysis would be invalid, requiring a reassessment of the wave structure. However, as long as the price remains above this level, navy blue wave 3 is expected to continue without interruption.
Summary
The EURGBP pair is currently in an impulsive phase, with navy blue wave 3 unfolding after the completion of wave 2. The market is expected to continue in alignment with this wave unless the price breaches the invalidation level of 0.84181.
EUR/GBP Elliott Wave technical analysis [Video]
Author

Peter Mathers
TradingLounge
Peter Mathers started actively trading in 1982. He began his career at Hoei and Shoin, a Japanese futures trading company.


