EUR/GBP Elliott Wave technical analysis [Video]
![EUR/GBP Elliott Wave technical analysis [Video]](https://editorial.fxstreet.com/images/Markets/Currencies/Crosses/EURGBP/iStock-628561816_XtraLarge.jpg)
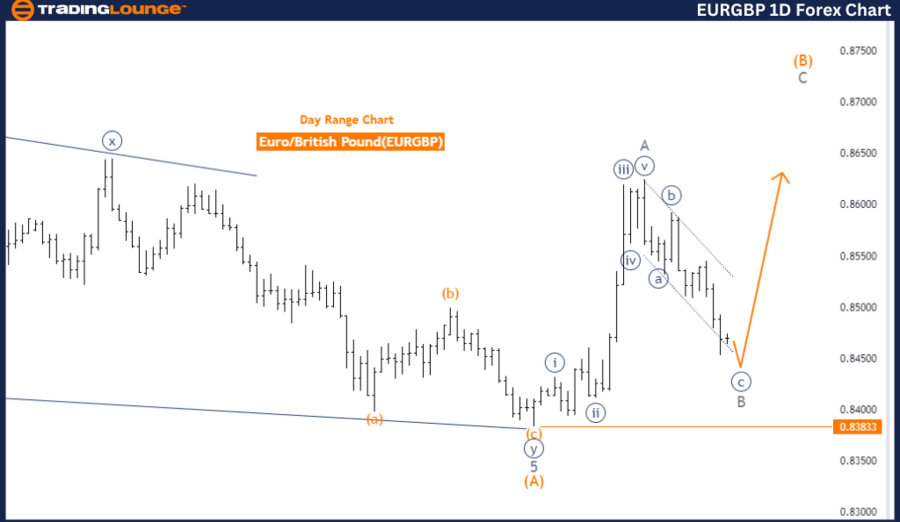
EUR/GBP Elliott Wave technical analysis
Function: Counter Trend.
Mode: Corrective.
Structure: Navy Blue Wave C.
Position: Gray Wave B.
Direction next higher degrees: Gray Wave C.
Details: Navy Blue Wave B appears completed, with Navy Blue Wave C now in progress.
Wave cancel invalid level: 0.83833.
The EUR/GBP pair is currently in a counter-trend phase, as analyzed using Elliott Wave theory on the daily chart. This analysis indicates that the market is in a corrective mode, suggesting a temporary movement against the prevailing trend. Within this corrective phase, the structure identified is Navy Blue Wave C, typically following the completion of a corrective wave sequence.
At present, the market is positioned within Gray Wave B, which seems to be nearing its completion. This indicates that the pullback or retracement in price associated with the corrective phase is concluding. Upon completion of Navy Blue Wave B, the market is expected to transition into Navy Blue Wave C. This transition would signify the continuation of the corrective phase, where the price moves opposite the primary trend before potentially resuming its previous trend direction.
The next higher degree of movement aligns with the continuation of Gray Wave C, suggesting that the corrective phase will extend as the market progresses through Navy Blue Wave C. This phase is crucial for traders to monitor, as it may present opportunities to identify potential reversal points or to position for the next significant market move.
A critical level to watch is 0.83833, identified as the wave cancel invalid level. If the market drops below this level, it would invalidate the current wave count, indicating a possible shift in market direction. This level serves as an essential reference for confirming whether the current corrective wave structure will hold or if a new trend may develop.
In summary, the EUR/GBP pair is in a corrective phase within a counter-trend mode, with the market currently transitioning from Navy Blue Wave B to Navy Blue Wave C. The continuation of this corrective phase hinges on the market holding above the crucial level of 0.83833, which serves as a validation point for the ongoing wave structure.
EUR/GBP day chart
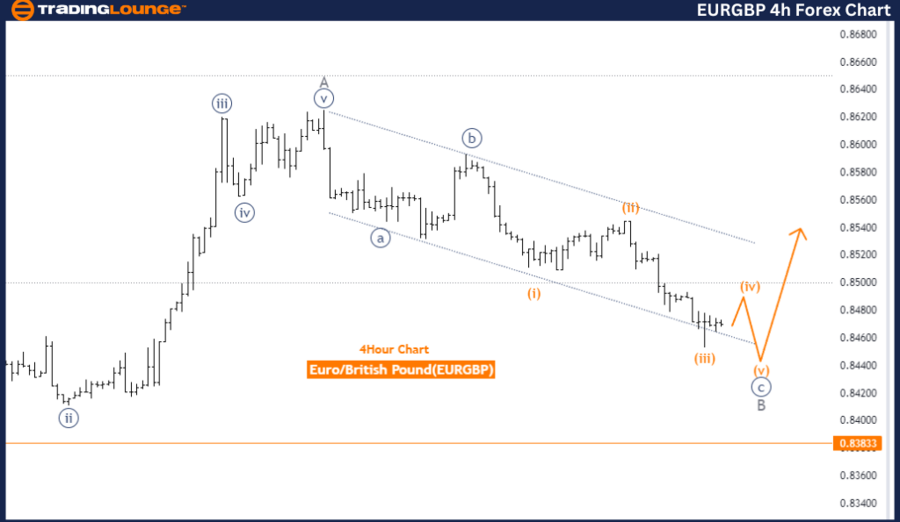
EUR/GBP Elliott Wave technical analysis
Function: Counter Trend.
Mode: Corrective.
Structure: Navy Blue Wave C.
Position: Gray Wave B.
Direction: Gray Wave C.
Details: Navy Blue Wave B appears completed, with Navy Blue Wave C now in progress.
Wave cancel invalid level: 0.83833.
The EUR/GBP pair is currently in a counter-trend phase, as analyzed using Elliott Wave theory on the 4-hour chart. This analysis indicates that the market is in a corrective mode, suggesting that the overall price movement represents a temporary reversal within a larger trend. The structure being observed is Navy Blue Wave C, part of a corrective wave sequence that usually follows a counter-trend move.
At this stage, the market is positioned within Gray Wave B, which is nearing its completion. This suggests that the corrective phase of the trend, including a pullback or retracement in price, is coming to an end. Upon completion of Navy Blue Wave B, the market is expected to transition into Navy Blue Wave C, marking the beginning of the next phase in the corrective sequence. This phase typically involves a movement opposite to the prior trend, often seen as a continuation or completion of the corrective pattern before the market resumes its previous trend direction.
The direction of the next higher degrees aligns with the continuation of Gray Wave C, indicating that the market is likely to experience further corrective movements as it progresses through Navy Blue Wave C. This stage is crucial for traders looking to identify potential reversal points or opportunities to position themselves for the next significant trend.
A critical level to monitor is 0.83833, identified as the wave cancel invalid level. If the market falls below this level, it would suggest that the current wave count and anticipated corrective movement might be invalidated, signaling a potential shift in the market’s direction. This level serves as a key reference point for confirming the continuation of the corrective phase.
In summary, EUR/GBP is in a corrective phase within a counter-trend mode, with Navy Blue Wave C currently active following the completion of Navy Blue Wave B. The market is expected to continue its corrective movement, with 0.83833 serving as a critical level to watch for the validity of the current wave structure.
EUR/GBP four-hour chart
EUR/GBP Elliott Wave technical analysis [Video]
Author

Peter Mathers
TradingLounge
Peter Mathers started actively trading in 1982. He began his career at Hoei and Shoin, a Japanese futures trading company.


