EUR/GBP Elliott Wave technical analysis [Video]
![EUR/GBP Elliott Wave technical analysis [Video]](https://editorial.fxstreet.com/images/Markets/Currencies/Crosses/EURGBP/iStock-1051145558_XtraLarge.jpg)
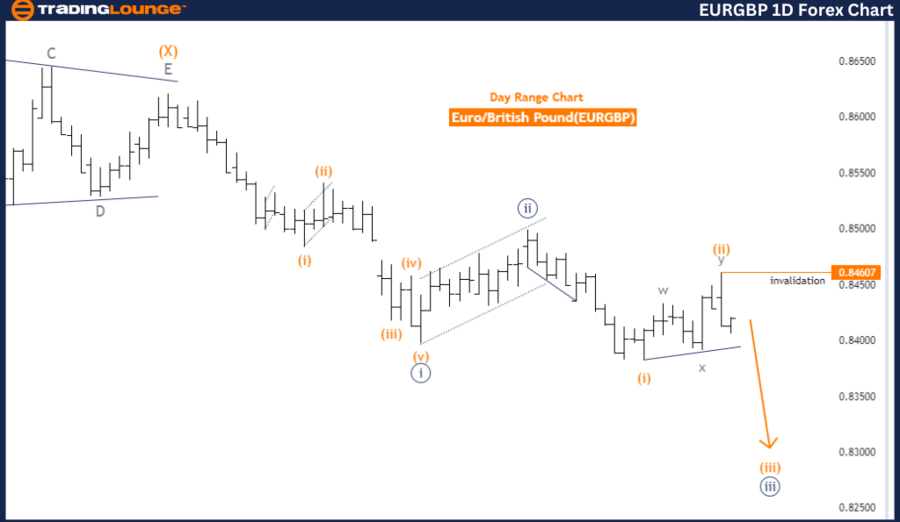
Elliott Wave Analysis Trading Lounge Day Chart, Euro/British Pound (EURGBP).
EUR/GBP Elliott Wave technical analysis
-
Function: Trend.
-
Mode: Impulsive.
-
Structure: Orange Wave 3.
-
Position: Navy Blue Wave 3.
-
Direction next lower degrees: Orange Wave 3.
-
Details: Orange Wave 2 appears completed, now in Orange Wave 3 of 3.
Cancel Invalid level: 0.84607.
The EURGBP Elliott Wave Analysis on the day chart indicates a trend with an impulsive mode. The current structure under examination is Orange Wave 3, positioned within Navy Blue Wave 3. This suggests the market is experiencing a strong, directional movement phase.
The completion of Orange Wave 2 marks the transition into Orange Wave 3 of 3, indicating continued impulsive movements. This progression implies that a significant correction or consolidation phase has ended, positioning the market for continued directional trends.
The direction for the next lower degrees is also identified as Orange Wave 3. This means the impulsive phase within Navy Blue Wave 3 is likely to continue, offering ongoing momentum and potential trading opportunities. The continuation of Orange Wave 3 highlights a robust and persistent trend, further supporting the current market direction.
A critical element of this analysis is the wave cancellation invalid level, set at 0.84607. This level serves as a key threshold for validating the current wave analysis. If the market price falls below this level, it would invalidate the current wave count, indicating a need to reassess the wave structure and potentially revise the market outlook.
In summary, the EURGBP day chart analysis shows the market in an impulsive phase within Orange Wave 3, following the completion of Orange Wave 2. The market is expected to continue its strong trend as Orange Wave 3 of 3 progresses. The wave cancellation invalid level of 0.84607 is crucial for validating the current analysis, serving as a threshold to reassess the wave structure if exceeded.
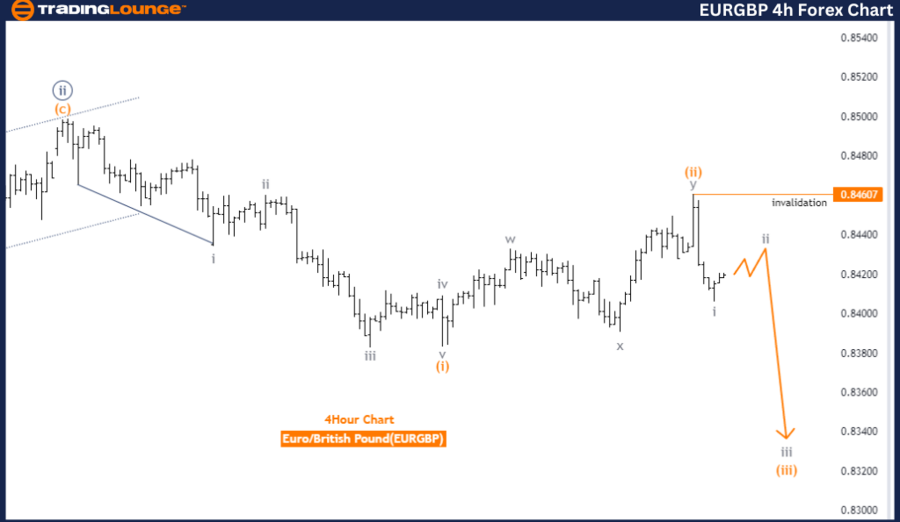
Euro/British Pound (EURGBP).
EUR/GBP Elliott Wave technical analysis
-
Function: Counter Trend.
-
Mode: Corrective.
-
Structure: Gray Wave 2.
-
Position: Orange Wave 3.
-
Direction next lower degrees: Gray Wave 3.
-
Details: Gray Wave 1 appears completed, now in Gray Wave 2 of 3.
Cancel Invalid level: 0.84607.
The EURGBP Elliott Wave Analysis on the 4-hour chart indicates a counter trend function with a corrective mode. The structure under analysis is Gray Wave 2, positioned within Orange Wave 3. This suggests the market is currently undergoing a corrective phase following the completion of Gray Wave 1.
The analysis shows that Gray Wave 1 appears to be complete, leading to the transition into Gray Wave 2 of 3. This phase is characterized by corrective movements, indicating that the market is retracing some progress made during Gray Wave 1. The corrective nature of Gray Wave 2 suggests a temporary pause or reversal in the market's previous impulsive movements.
The direction for the next lower degrees is identified as Gray Wave 3. Upon completing Gray Wave 2, the market is expected to enter Gray Wave 3, likely resuming impulsive movement. This transition from a corrective phase to an impulsive phase suggests the market may soon continue a more directional trend.
A crucial aspect of this analysis is the wave cancellation invalid level, set at 0.84607. This level serves as a key threshold for validating the current wave analysis. If the market price drops below this level, it would invalidate the current wave count, indicating that the expected wave pattern is no longer valid and necessitating a reevaluation of the wave count.
In summary, the EURGBP 4-hour chart analysis indicates the market is in a corrective phase within Gray Wave 2, following the completion of Gray Wave 1. The market is expected to transition into Gray Wave 3 after Gray Wave 2 completes. The wave cancellation invalid level of 0.84607 is essential for validating the current analysis, serving as a threshold to reassess the wave structure if exceeded.
Technical analyst: Malik Awais.
EUR/GBP Elliott Wave technical analysis [Video]
Author

Peter Mathers
TradingLounge
Peter Mathers started actively trading in 1982. He began his career at Hoei and Shoin, a Japanese futures trading company.


