EUR/GBP Elliott Wave technical analysis [Video]
![EUR/GBP Elliott Wave technical analysis [Video]](https://editorial.fxstreet.com/images/Markets/Currencies/Crosses/EURGBP/display-stock-market-data-28943278_XtraLarge.jpg)
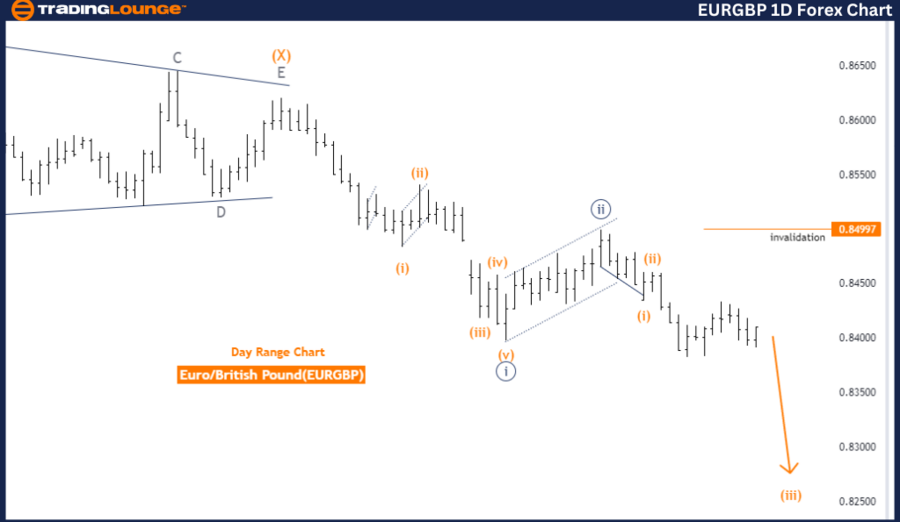
Elliott Wave Analysis Trading Lounge Day Chart, Euro/British Pound (EURGBP) Day Chart.
EUR/GBP Elliott Wave technical analysis
Function: Trend.
Mode: Impulsive.
Structure: Orange wave 3.
Position: Navy blue wave 3.
Direction next higher degrees: Orange wave 4.
Details: Orange wave 2 appears complete; now orange wave 3 of 3 is active.
Wave cancel invalid level: 0.84997.
The EURGBP Elliott Wave Analysis on the day chart suggests the market is currently in a trending phase. The trend's mode is impulsive, indicating strong, directional price movements. The specific wave structure being analyzed is orange wave 3, positioned within navy blue wave 3. This position indicates the market is in the third wave of a larger impulsive sequence, often characterized by substantial price movements within the wave cycle.
The next higher degree direction is indicated as orange wave 4. This suggests that following the completion of the current impulsive wave (orange wave 3), the market is expected to enter a corrective phase (orange wave 4). This phase typically involves a pullback or consolidation before the market resumes its primary trend direction.
Detailed analysis shows that orange wave 2 appears to be complete. This suggests that the market has finished a corrective phase and has now entered orange wave 3 of 3, which is part of the impulsive sequence. This wave is crucial as it generally indicates a strong continuation of the trend, often marked by significant price movements.
A critical aspect of this analysis is the wave cancellation invalid level, set at 0.84997. This level is vital for validating the current wave structure. If the market price falls below this point, it would invalidate the current wave analysis, necessitating a re-evaluation of the wave pattern.
In summary, the EURGBP day chart analysis indicates the market is in an impulsive trend phase within orange wave 3, following the completion of orange wave 2. The current focus is on orange wave 3 of 3 within this structure, suggesting strong upward momentum. The analysis anticipates a transition to orange wave 4, a corrective phase, once the current impulsive wave completes. The wave cancel invalid level is 0.84997, crucial for maintaining the validity of the current wave analysis.
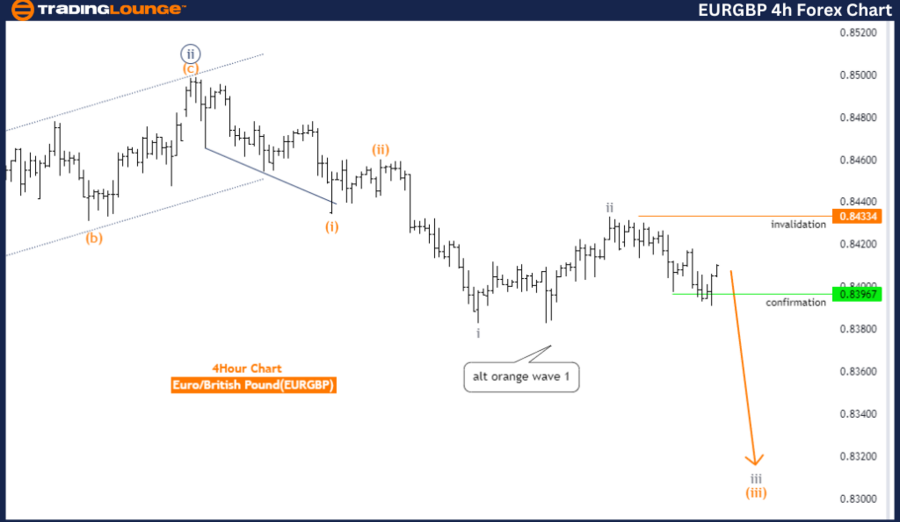
EUR/GBP Elliott Wave four-hour chart
Function: Trend.
Mode: Impulsive.
Structure: Gray wave 3.
Position: Orange wave 3.
Direction next higher degrees: Gray wave 4.
Details: Gray wave 2 appears complete; now gray wave 3 of 3 is active.
Wave cancel invalid level: 0.84334.
The EURGBP Elliott Wave Analysis on the 4-hour chart suggests the market is in a trend phase. The mode of this trend is impulsive, indicating strong, directional price movements. The current wave structure under analysis is gray wave 3, with a specific focus on orange wave 3 within this structure. This positioning implies the market is in the third wave of a larger impulsive sequence, typically characterized by the most substantial price movement within the wave cycle.
The next higher degree direction is indicated as gray wave 4. This suggests that after the completion of the current impulsive wave (gray wave 3), the market is expected to enter a corrective phase (gray wave 4). This phase usually involves a pullback or consolidation before the market resumes its primary trend direction.
Detailed analysis shows that gray wave 2 appears to be complete. This suggests the market has finished a corrective phase and has now entered gray wave 3 of 3, which is part of the impulsive sequence. This wave is crucial as it generally indicates a strong continuation of the trend, often marked by significant price movements.
A critical aspect of this analysis is the wave cancellation invalid level, set at 0.84334. This level is vital for validating the current wave structure. If the market price falls below this point, it would invalidate the current wave analysis, necessitating a re-evaluation of the wave pattern.
In summary, the EURGBP 4-hour chart analysis indicates the market is in an impulsive trend phase, specifically within gray wave 3, following the completion of gray wave 2. The current focus is on orange wave 3 within this structure, suggesting strong upward momentum. The analysis anticipates a transition to gray wave 4, a corrective phase, once the current impulsive wave completes. The wave cancel invalid level is 0.84334, crucial for maintaining the validity of the current wave analysis.
EUR/GBP Elliott Wave technical analysis [Video]
Author

Peter Mathers
TradingLounge
Peter Mathers started actively trading in 1982. He began his career at Hoei and Shoin, a Japanese futures trading company.


